How to Run Python in an Open Excel Workbook (EASY) | Combine Excel & Python | xlwings Tutorial

Introduction
In this tutorial, I will show you how to run Python in an open Excel workbook. Specifically, I’ll cover how to use a Python script to return results to Excel. By combining Excel and Python through the free open-source library xlwings, you can leverage Python’s capabilities to enhance your Excel functionalities.
At the end of this tutorial, I will provide practical examples, including plotting and updating stock market information, interacting with APIs, and even creating a PDF stock report. Please note that this tutorial will not cover how to execute a Python script from Excel; I will address that in a separate video.
Setting Up Your Environment
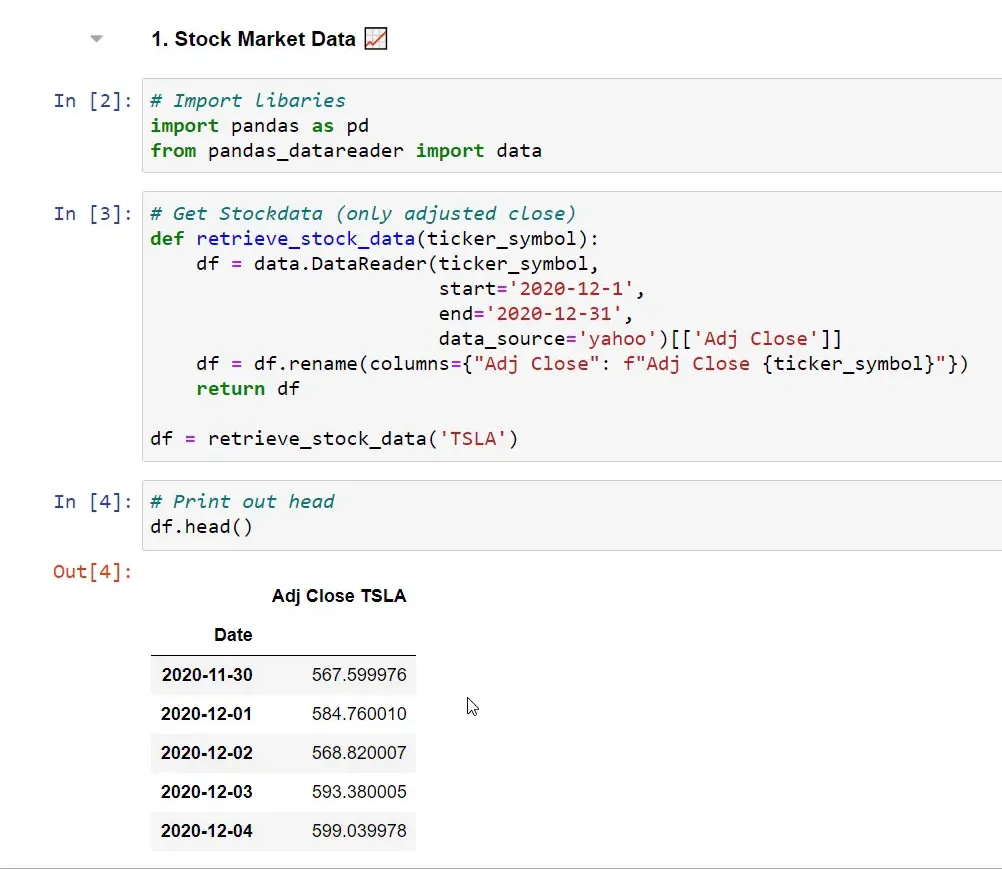
For this tutorial, I will create two datasets using the pandas library and the pandas data reader to retrieve stock market data. If you want to follow along, make sure you have these libraries installed. You can run the following command in a Jupyter notebook to install them:
pip install pandas pandas-datareader
Once installed, I will import the libraries. The function I’ll create will return a DataFrame containing the adjusted close price for any given ticker symbol. For this example, I will retrieve the adjusted close price for Tesla. The second dataset will contain miles per gallon information for different vehicles.
Inspecting DataFrames in Excel
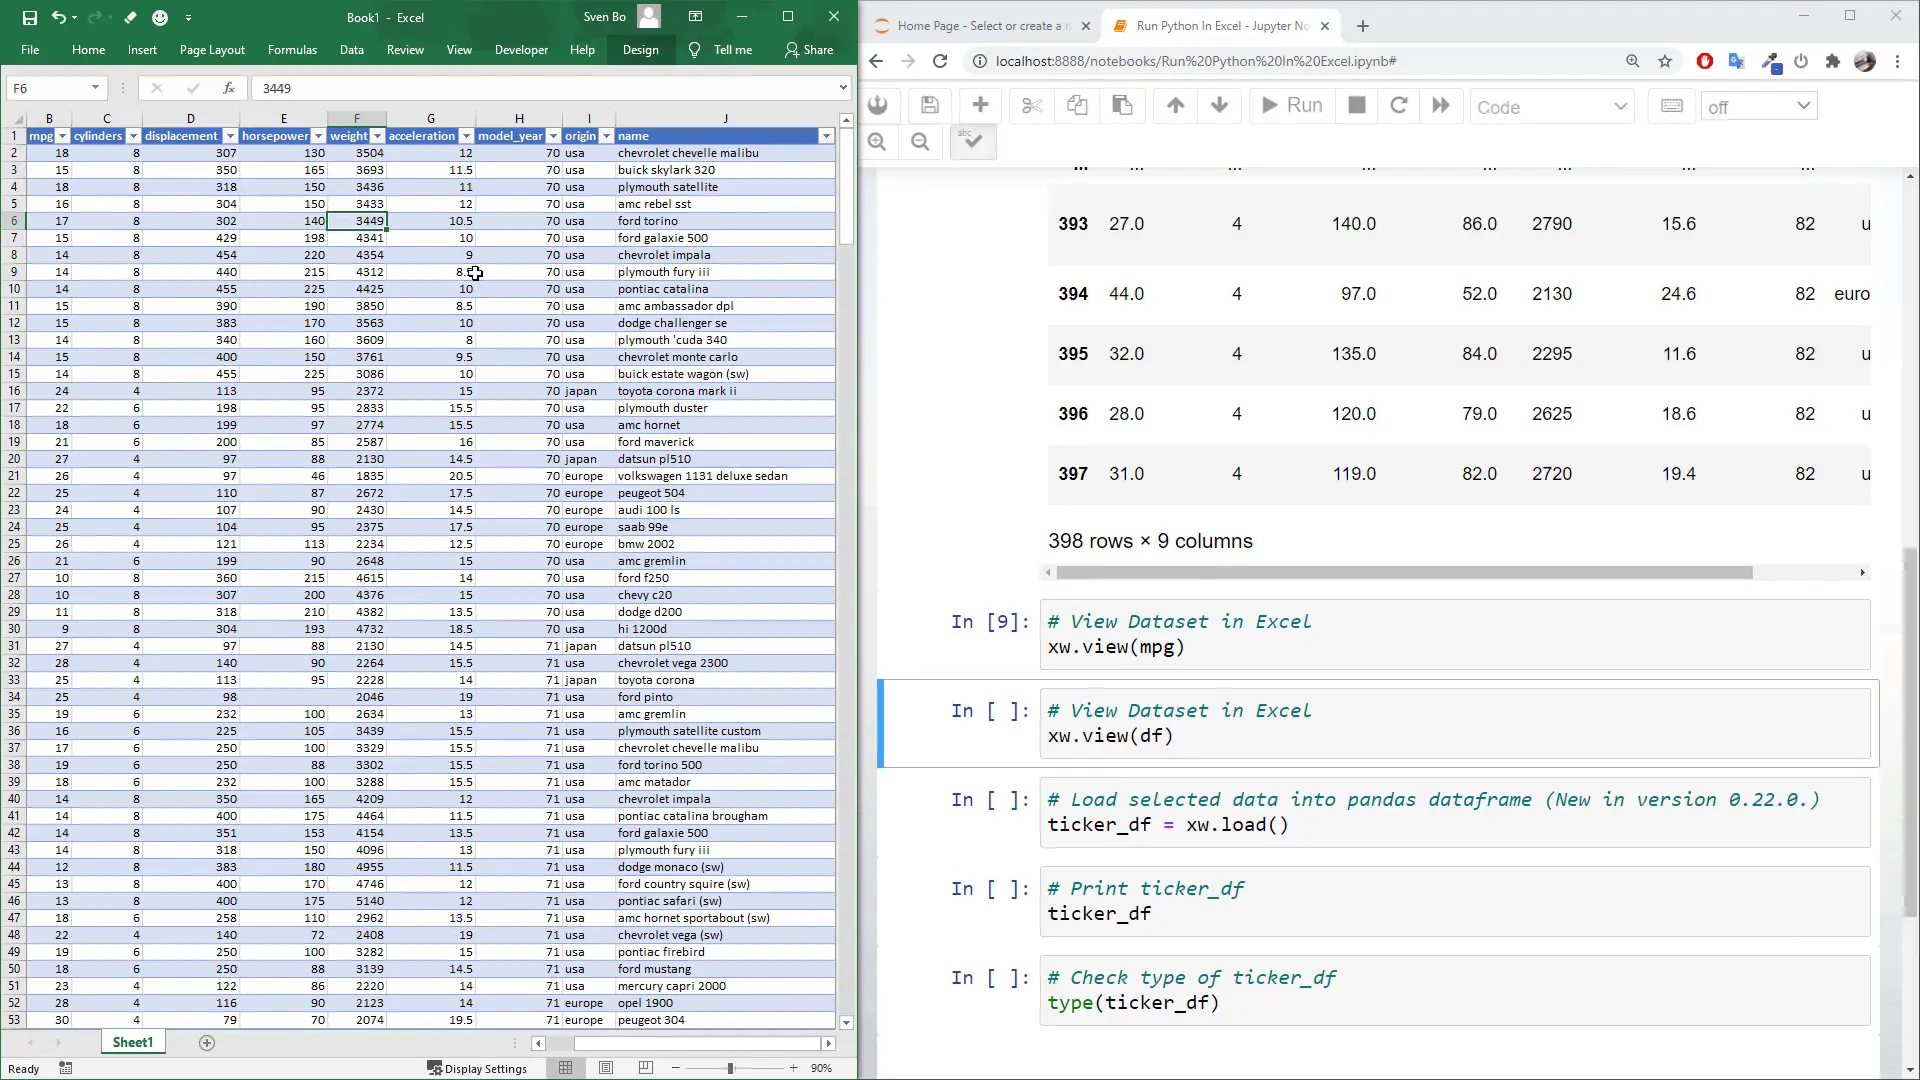
A quick and easy way to inspect any DataFrame directly in Excel is to use the xlwings view method. Running this method will open a new workbook, and the DataFrame will automatically be converted to an Excel table, allowing you to filter columns or scroll through available rows.
Connecting Python and Excel Workbooks
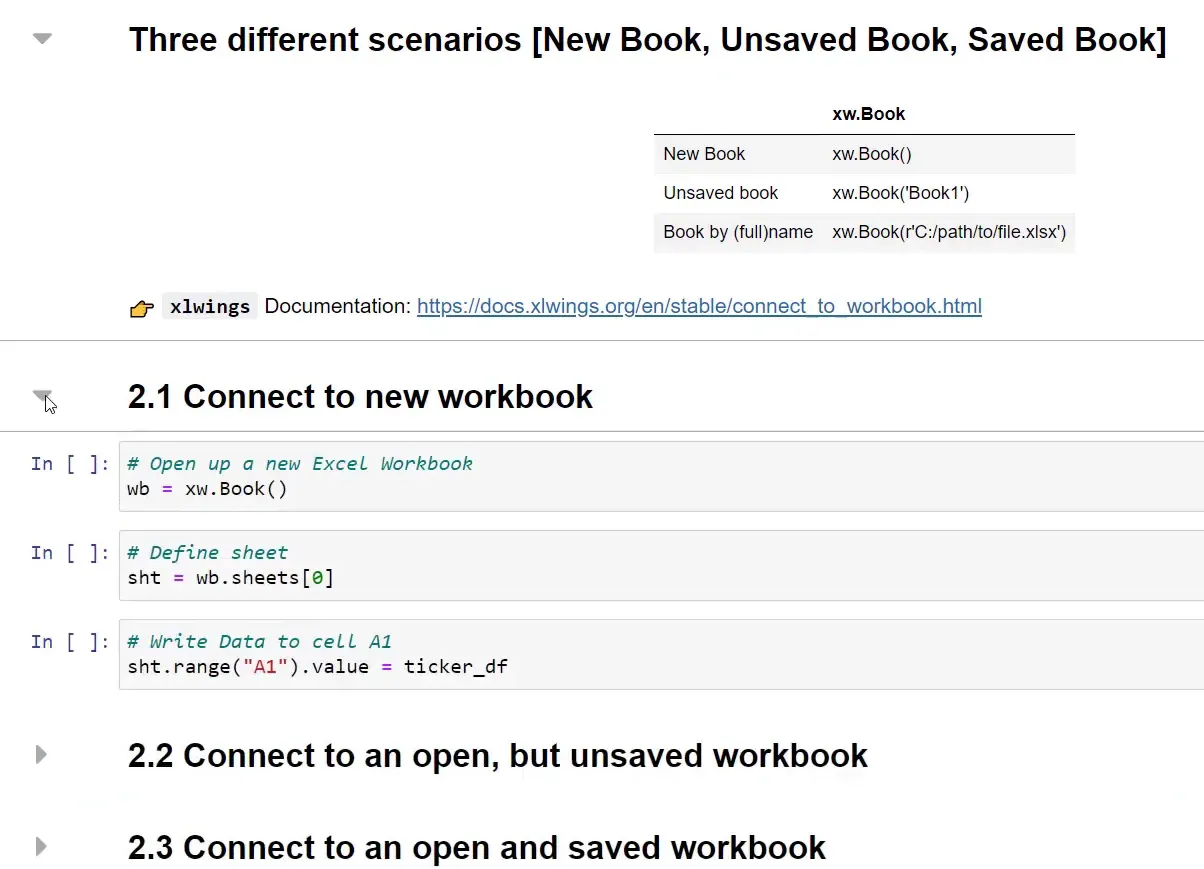
To connect Python to an Excel workbook, there are three scenarios:
- You want to run your code in a new workbook.
- You have an unsaved workbook open in which you want to run Python.
- You have a saved workbook that you want to manipulate.
For instance, to initiate a new workbook, you can use the command xw.Book(). This will allow you to interact with the first worksheet and specify the cell you want to manipulate.
Exporting DataFrames to Excel
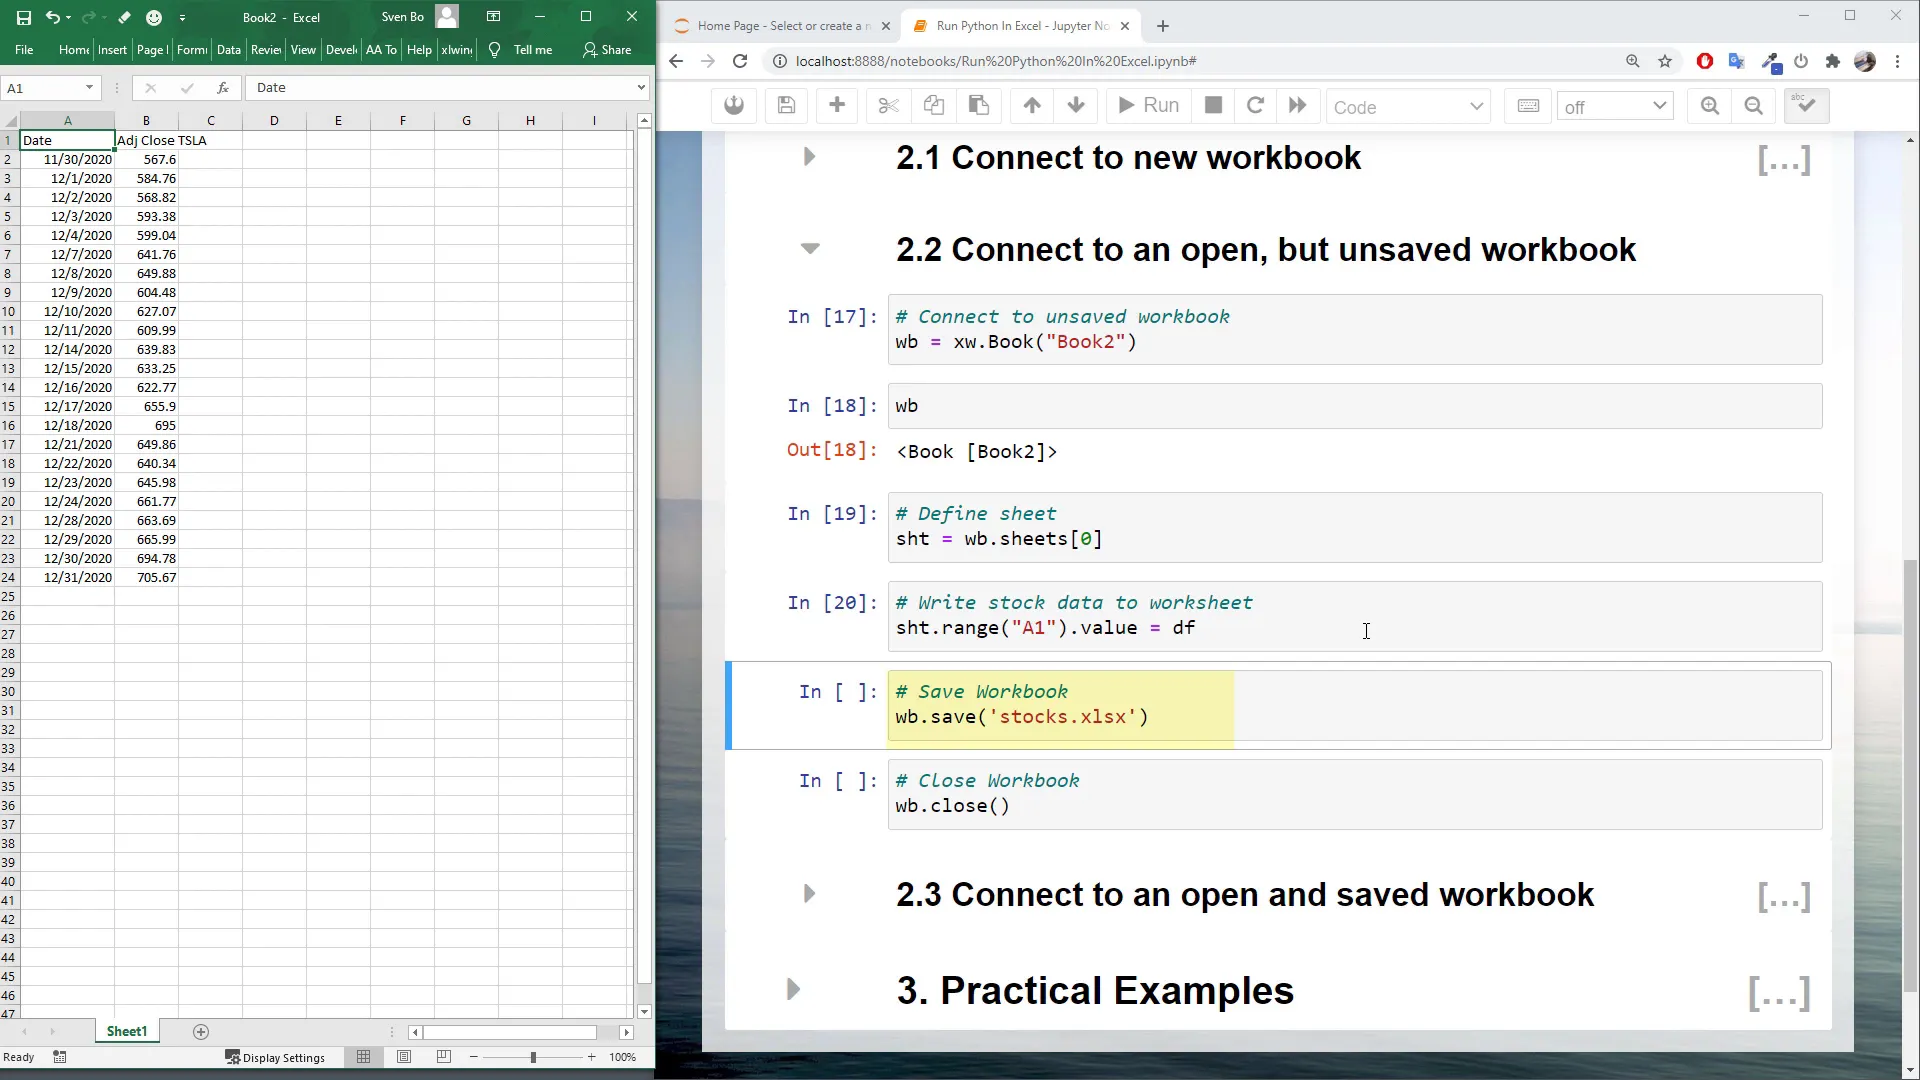
In the next step, I will connect to an open but unsaved workbook and export the stock market DataFrame to Excel. Once the data is exported, you can save the workbook using wb.save('filename.xlsx').
Reading and Writing Cell Values
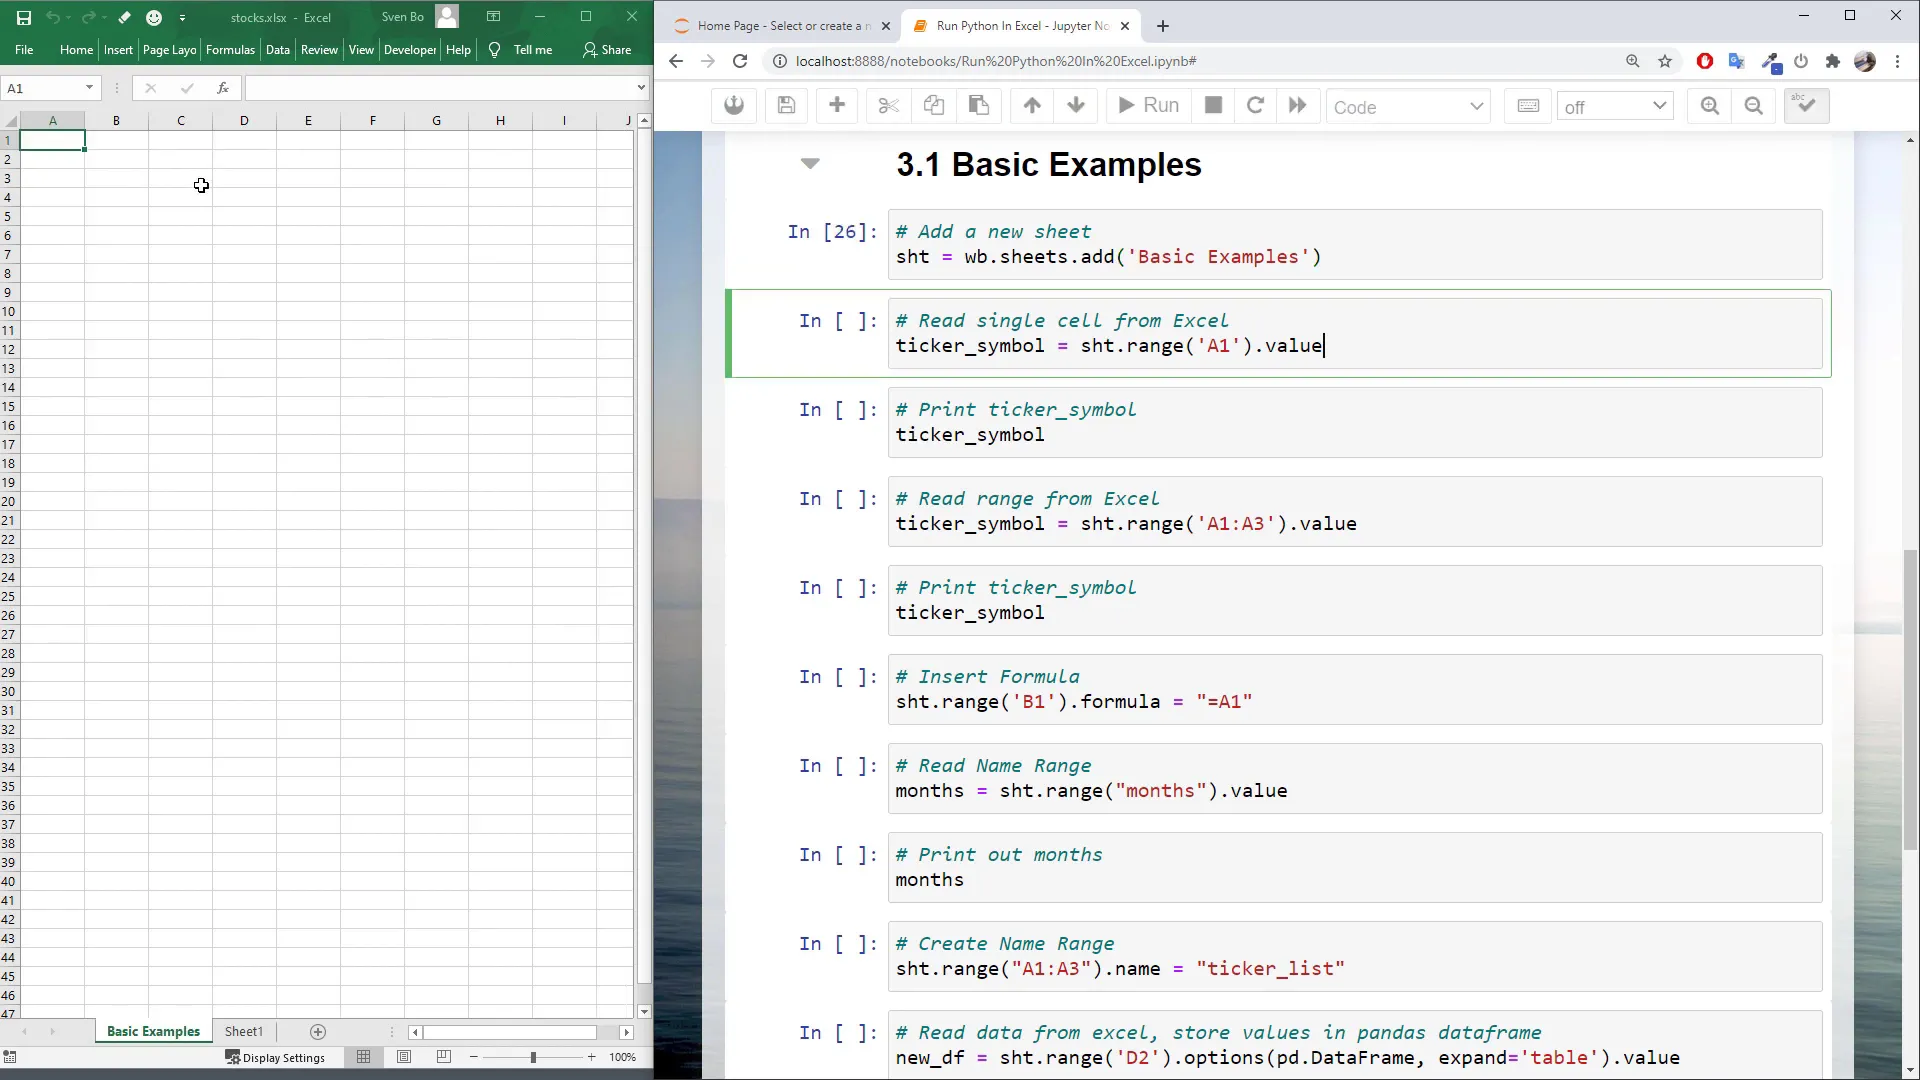
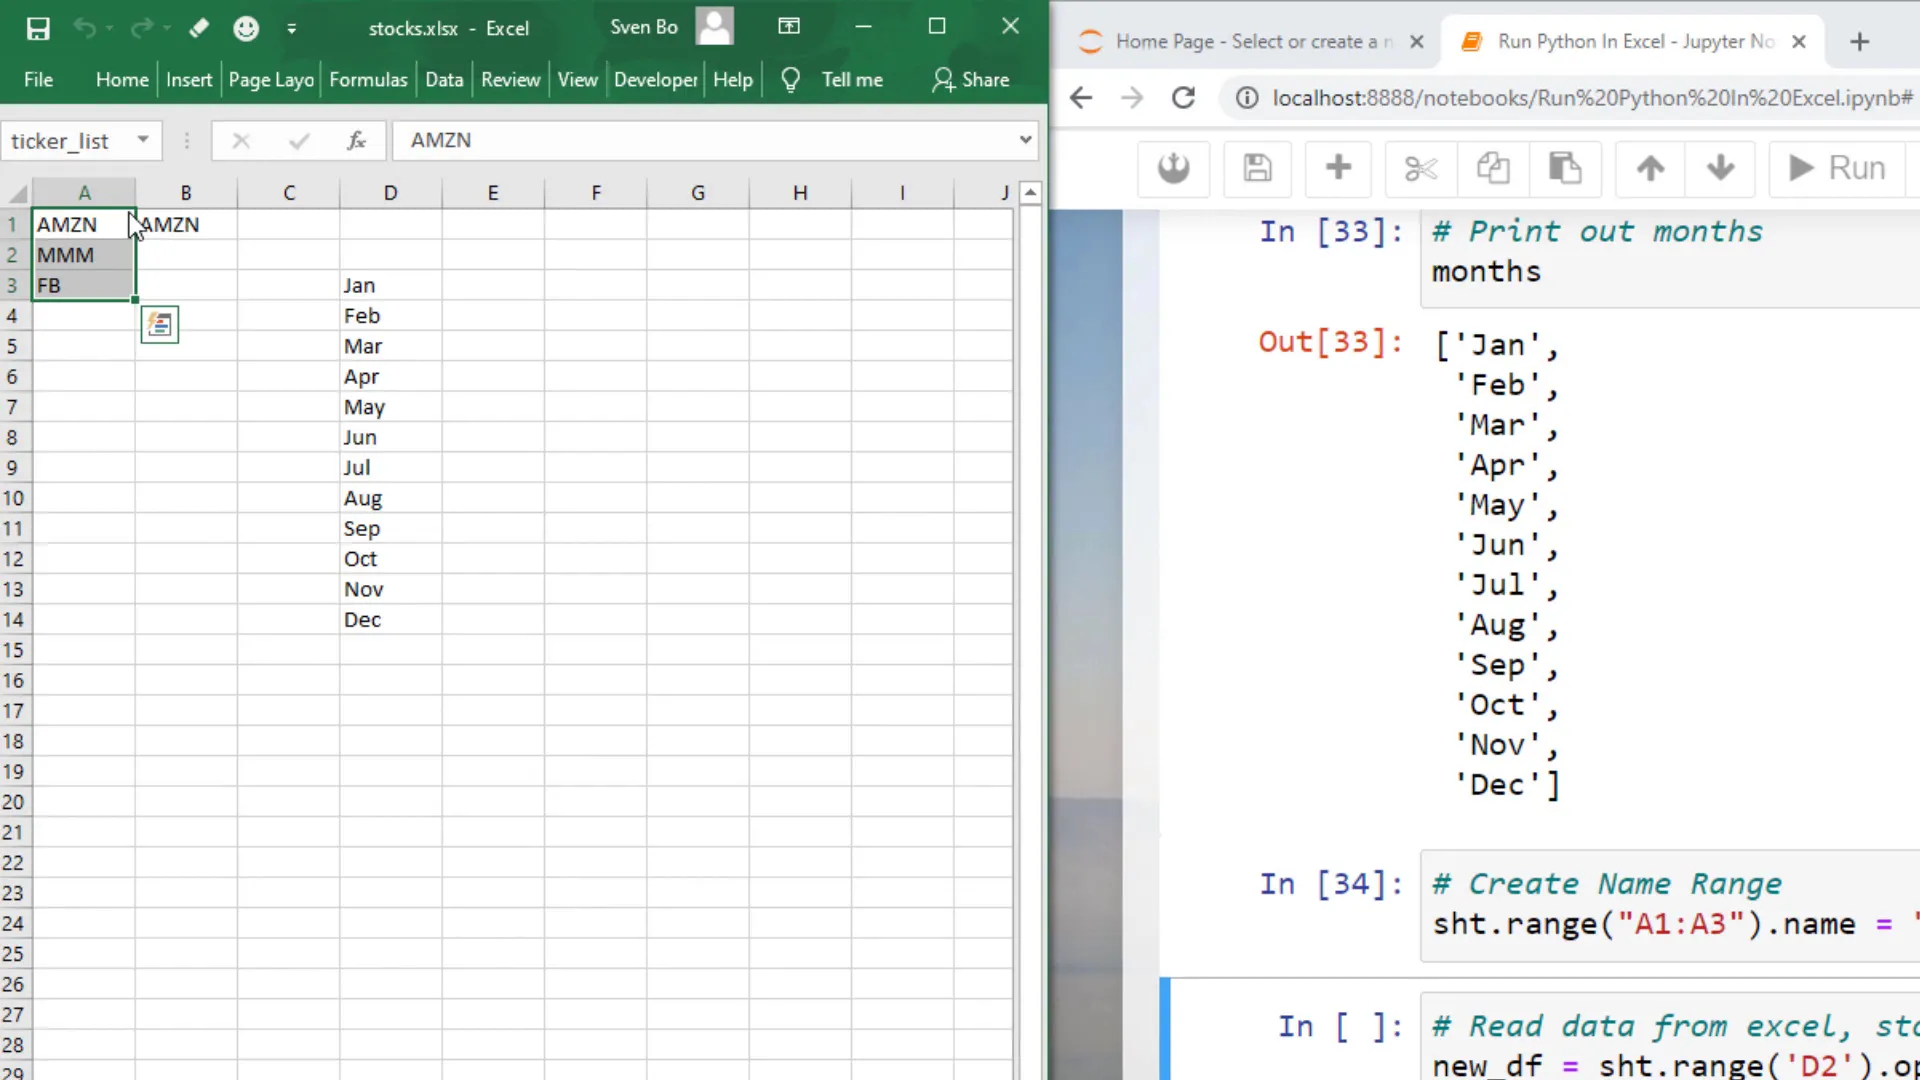
Reading cell values is straightforward. You can read a single cell or a range of cells, which excel wings will convert into a Python list. Additionally, you can insert Excel formulas via xlwings, making it a flexible tool for data manipulation.
Converting Excel Data to Pandas DataFrames
One of the standout features of xlwings is the ability to convert Excel data into a pandas DataFrame. This allows for further manipulation using pandas functions. You can also convert the workbook to a PDF after processing the data.
Practical Examples
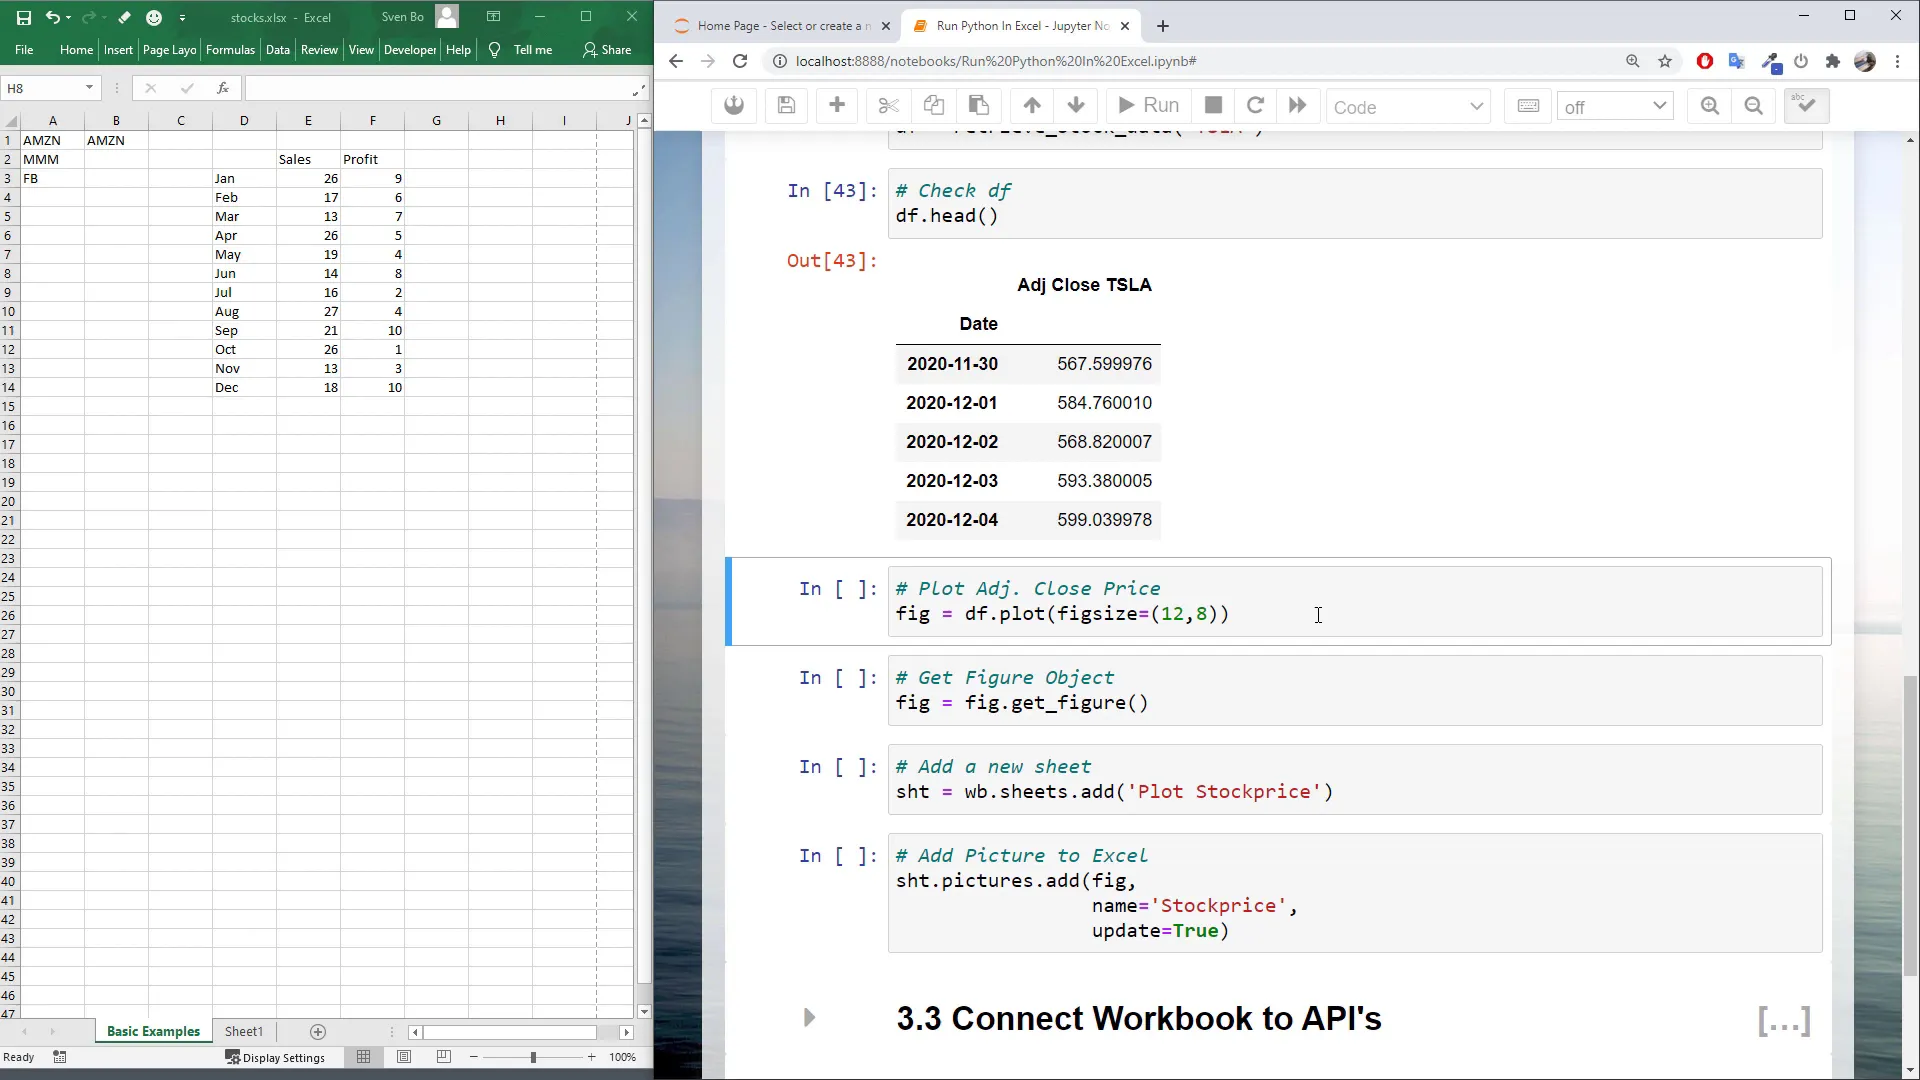
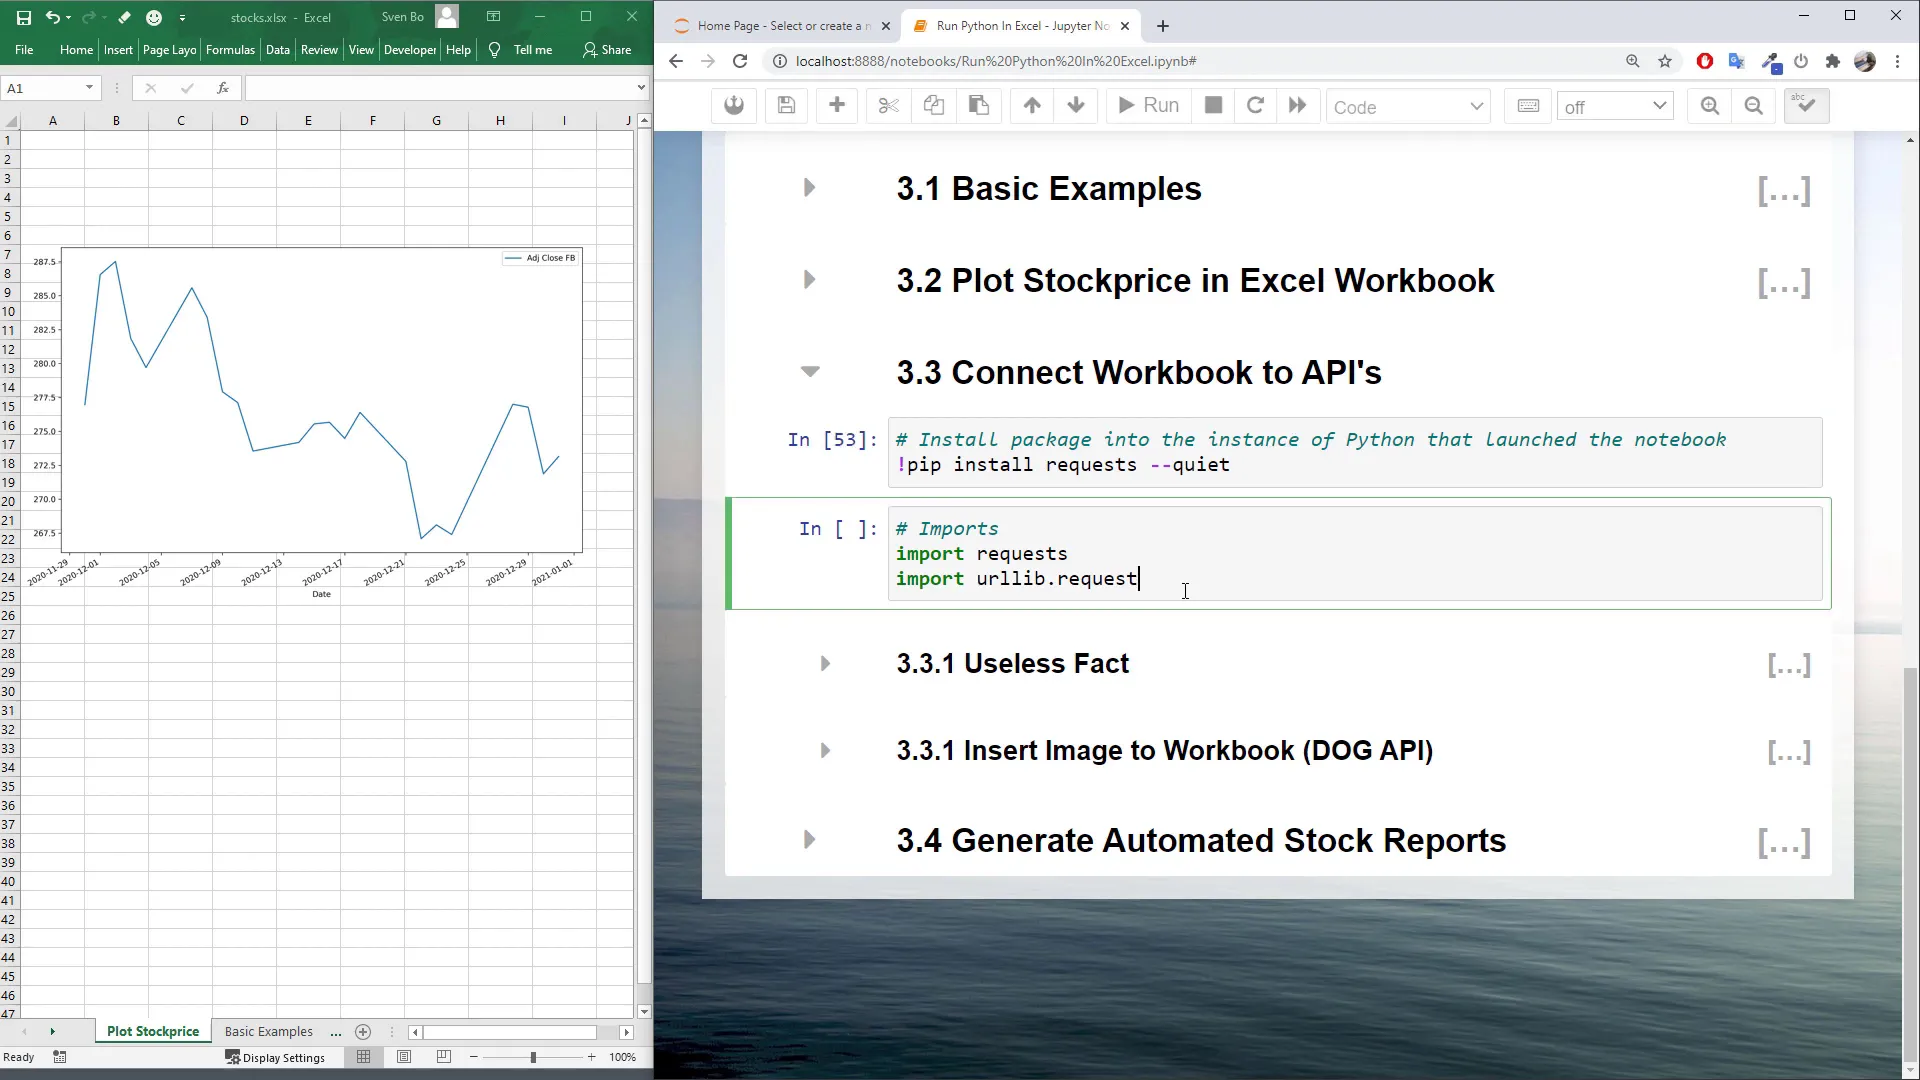
Using the matplotlib library, I will retrieve the adjusted close price for Tesla and plot it in a line chart. xlwings allows you to insert these charts directly into Excel, and with the update feature, the charts can be refreshed automatically.
Interacting with APIs
I will also demonstrate how to connect to an API using the requests library and return data directly to Excel. This integration showcases the power of combining Python’s extensive libraries with Excel’s functionality.
Finalizing Reports
In the concluding example, I will generate a stock report that includes cumulative returns, drawdowns, and a monthly return heat map. This report can be updated directly from Excel, showcasing the seamless integration between Python and Excel.

Conclusion
This tutorial illustrated how powerful xlwings can be when integrating Python with Excel. By leveraging the capabilities of Python libraries, you can enhance your data analysis and reporting processes significantly. I look forward to creating more tutorials on combining Excel and Python in the future.