Getting Started with Python in Excel

Introduction
Exciting news! You can now use Python inside Excel, and this integration opens up a world of possibilities for data analysis. In this blog post, I will explore some basic examples, guide you through a real-world analysis, and share my thoughts on this new feature, including its limitations.
Starting with a Basic Example
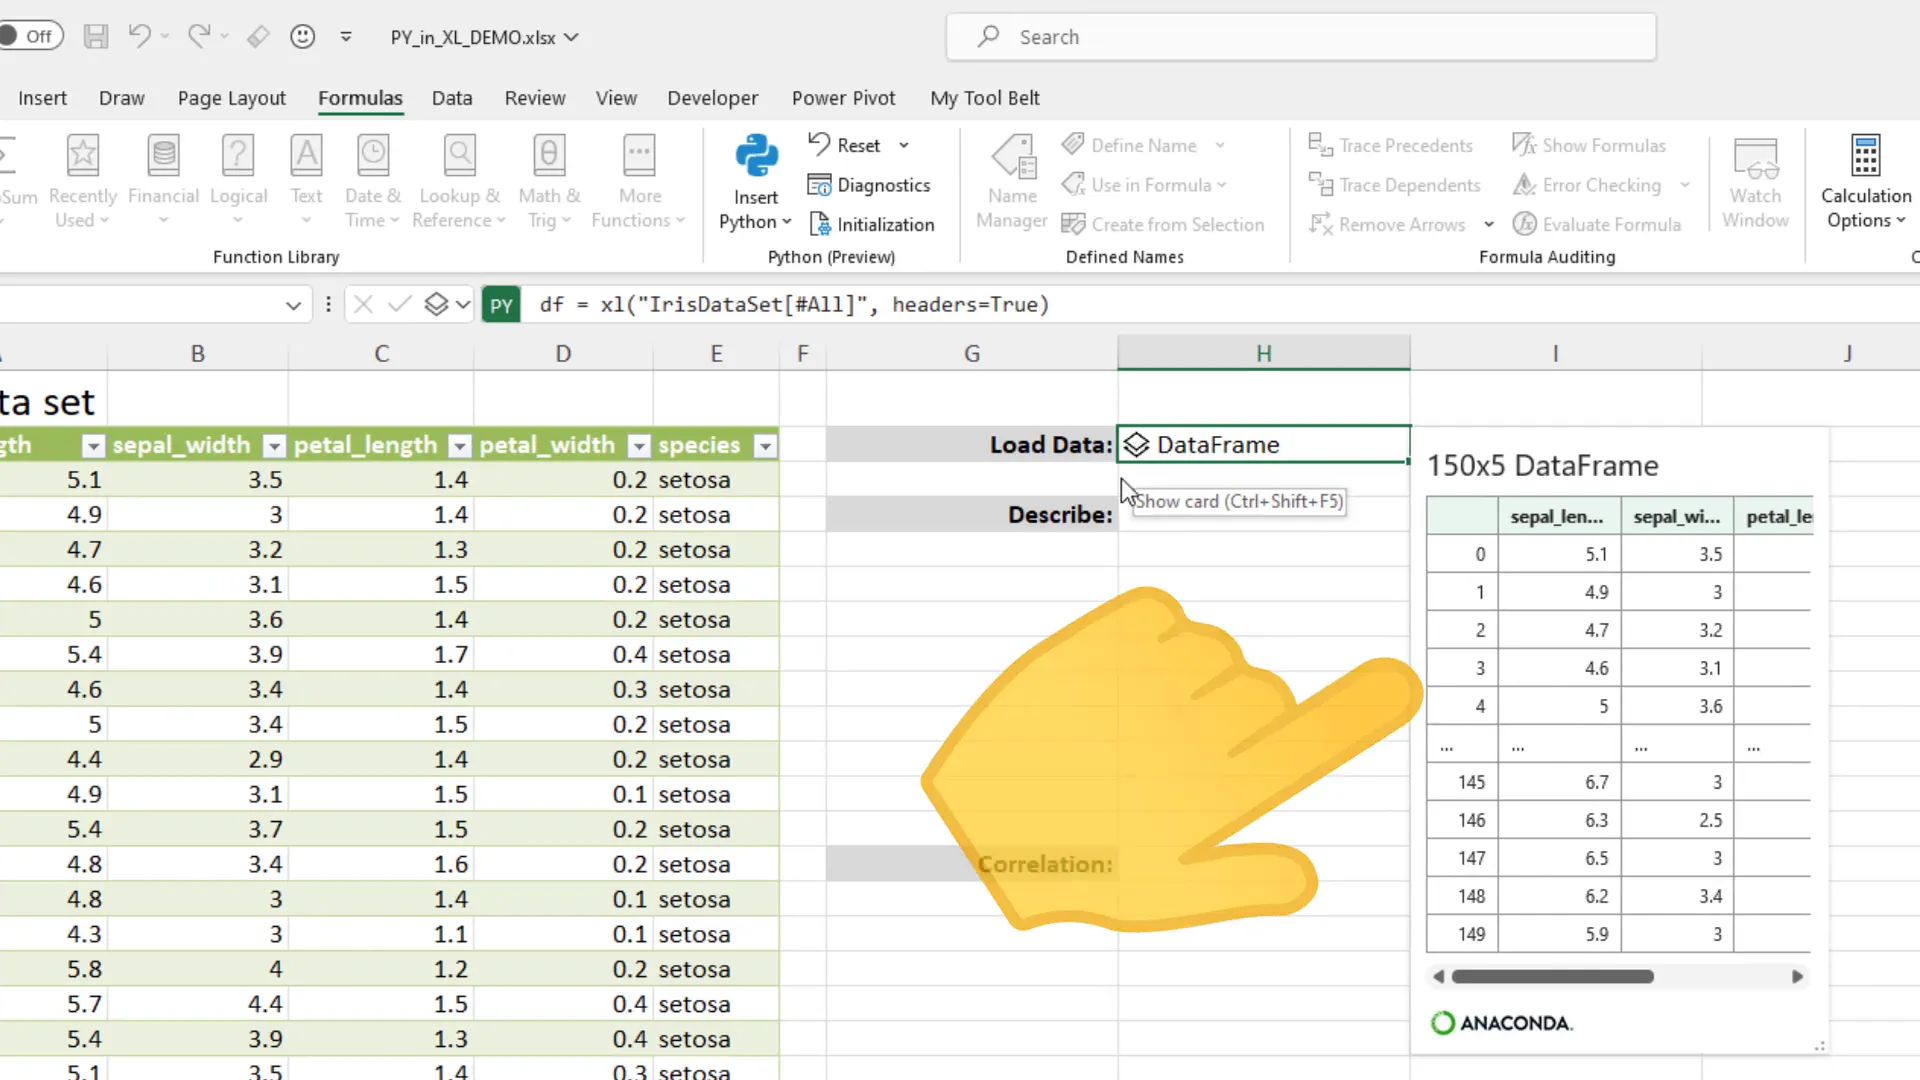
Let’s kick things off with a basic example. Under the formulas ribbon, there’s a new Python section. When I click on the Python logo, the formula bar changes, allowing me to write Python code directly. For the first step, I create a dataframe using the command df = and select my Excel table. This can also be a normal cell range.
To execute the code, I press Ctrl + Enter. The data source is now my table, recognized correctly with a header row. I can get a preview of the dataframe by clicking an icon, and I can use various Pandas functions on it.
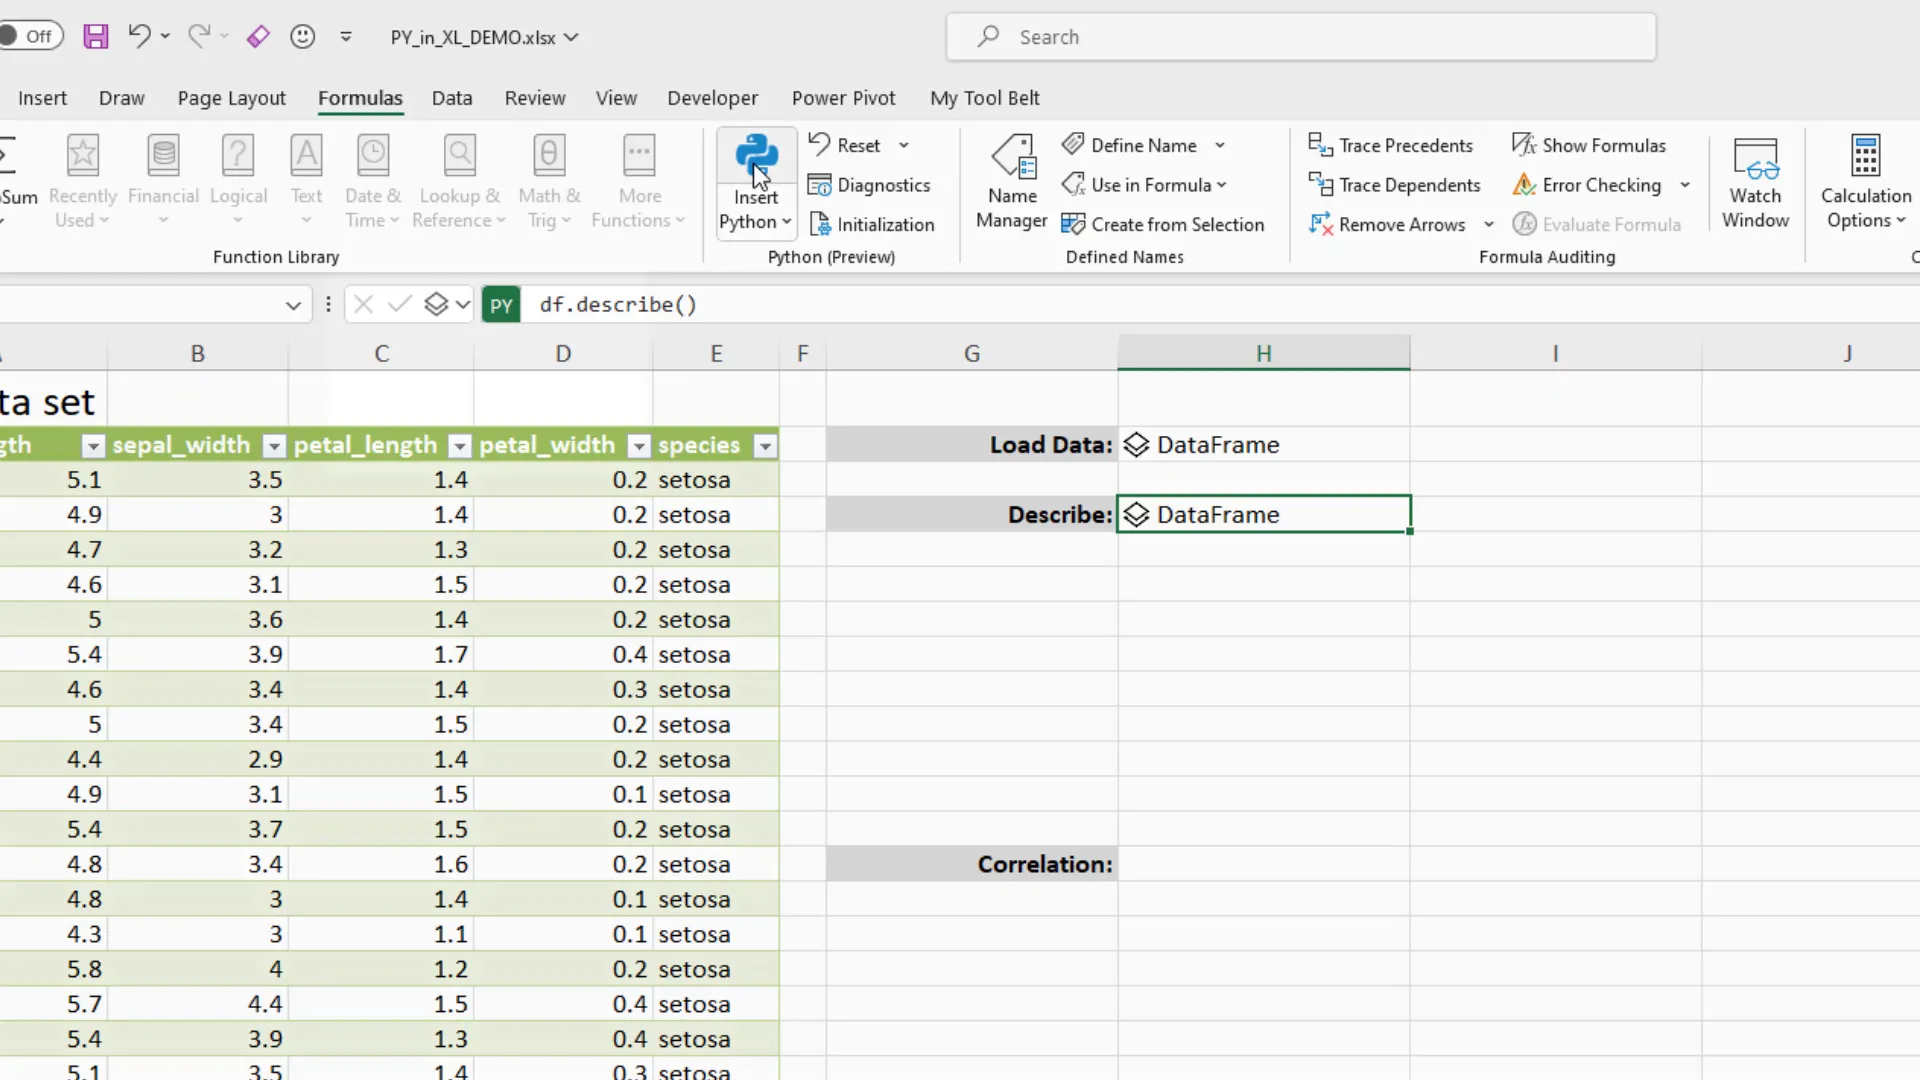
For example, I use the describe method to get statistical insights into the data. To print the dataframe to Excel, I select “Excel value” from the drop-down list to see a summary directly in the spreadsheet.
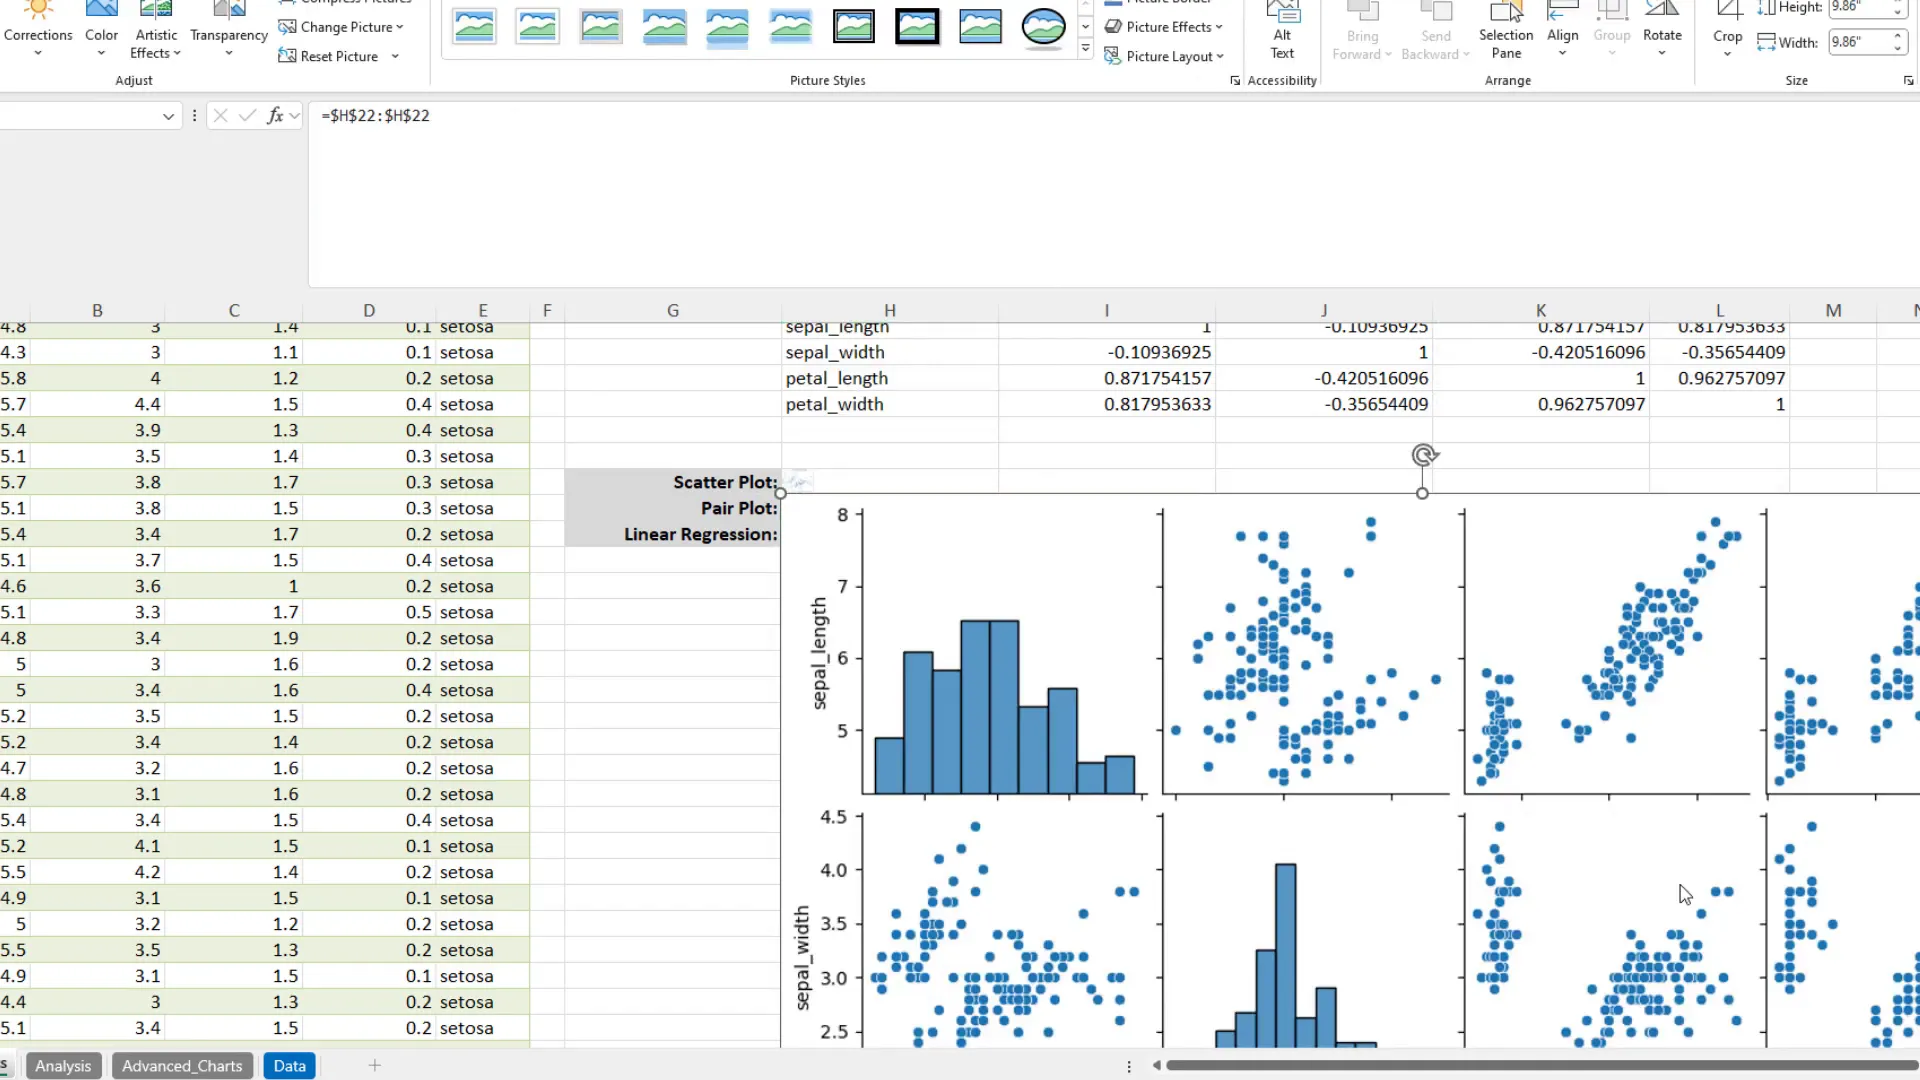
Next, I calculate the correlation of the dataframe and display it in the spreadsheet as well. Moving on to plotting, I utilize matplotlib to create a scatter plot and a Seaborn pair plot, both of which return image objects that I can display in Excel.
Diving into a Real-World Analysis
Now, let’s dive into a real-world example using a transaction table of sales for five different stores in Japan. This table contains various details, including customer information, product line, unit price, quantity, and sales amount.
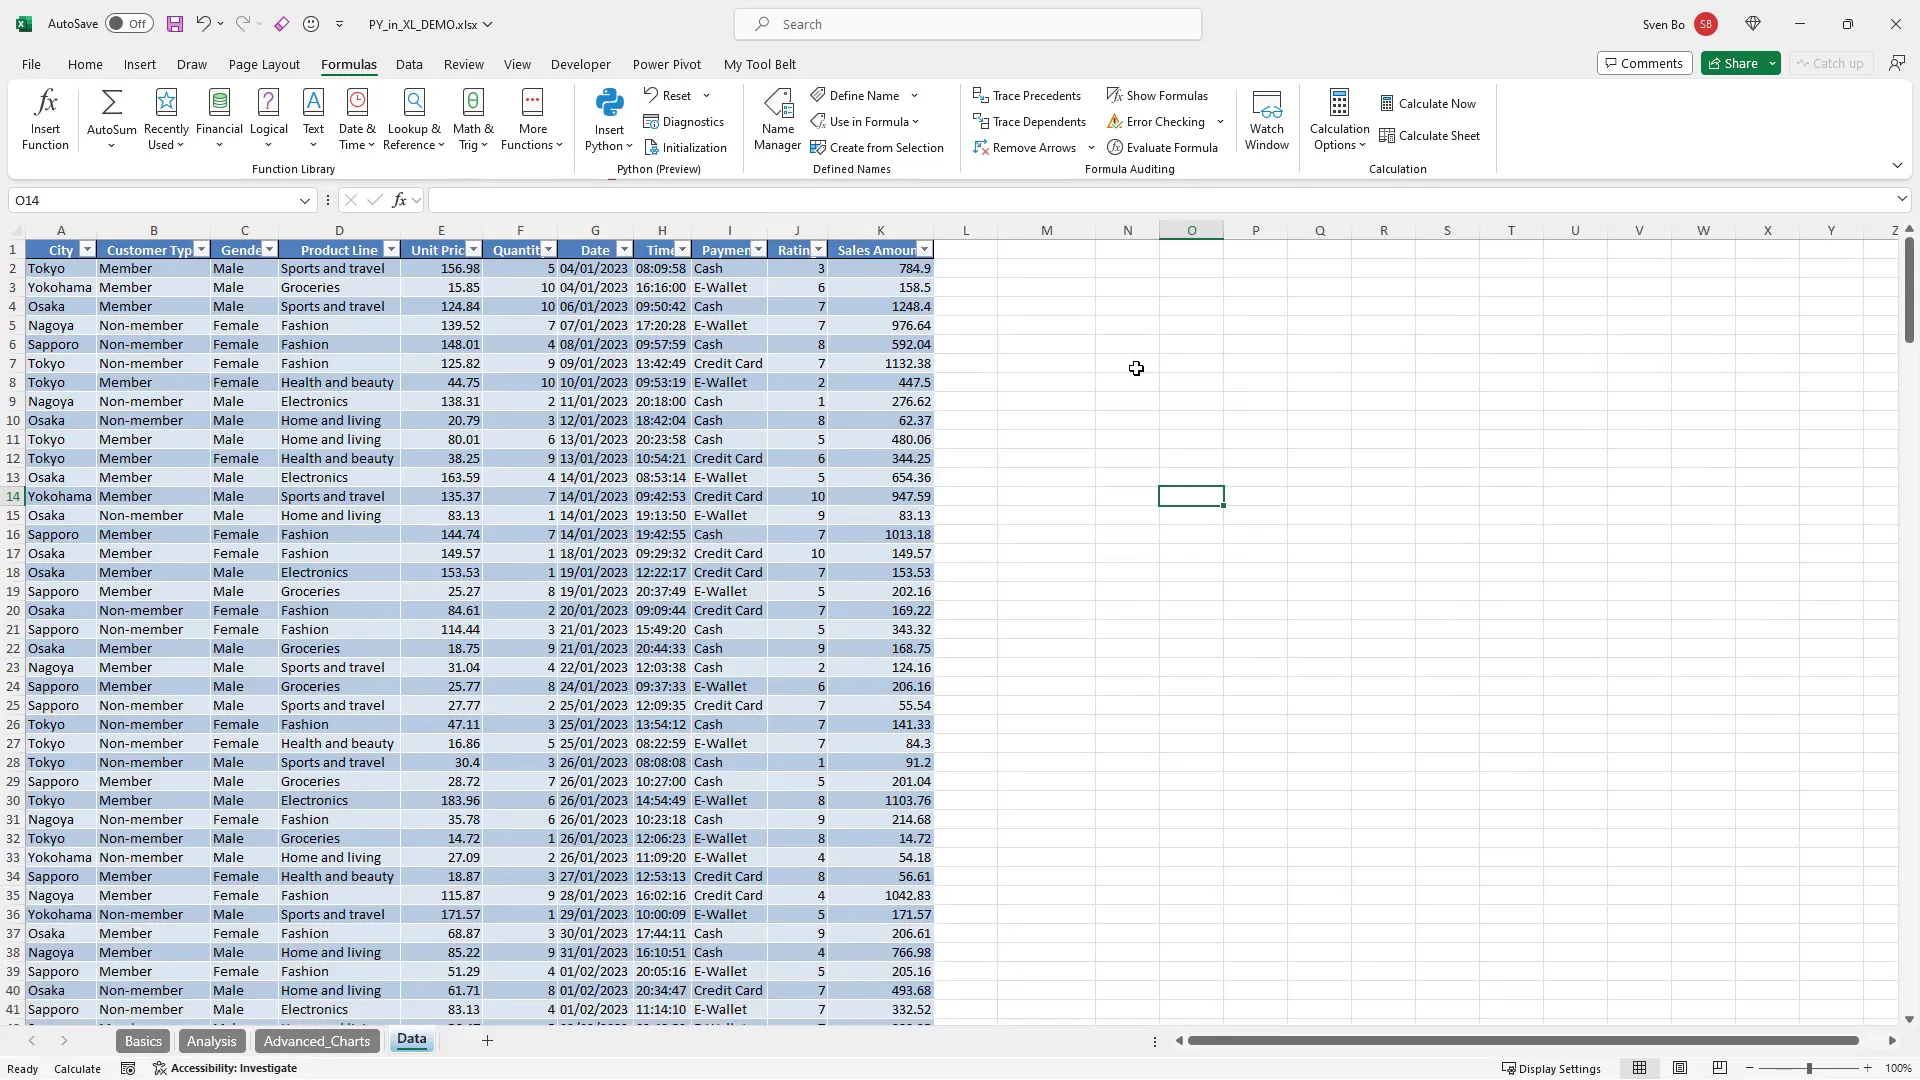
After loading the dataframe and naming it “data,” I perform some data cleanup, primarily converting the date and time column into a DateTime object for analysis. I then group the dataframe by product to find the top-selling products.
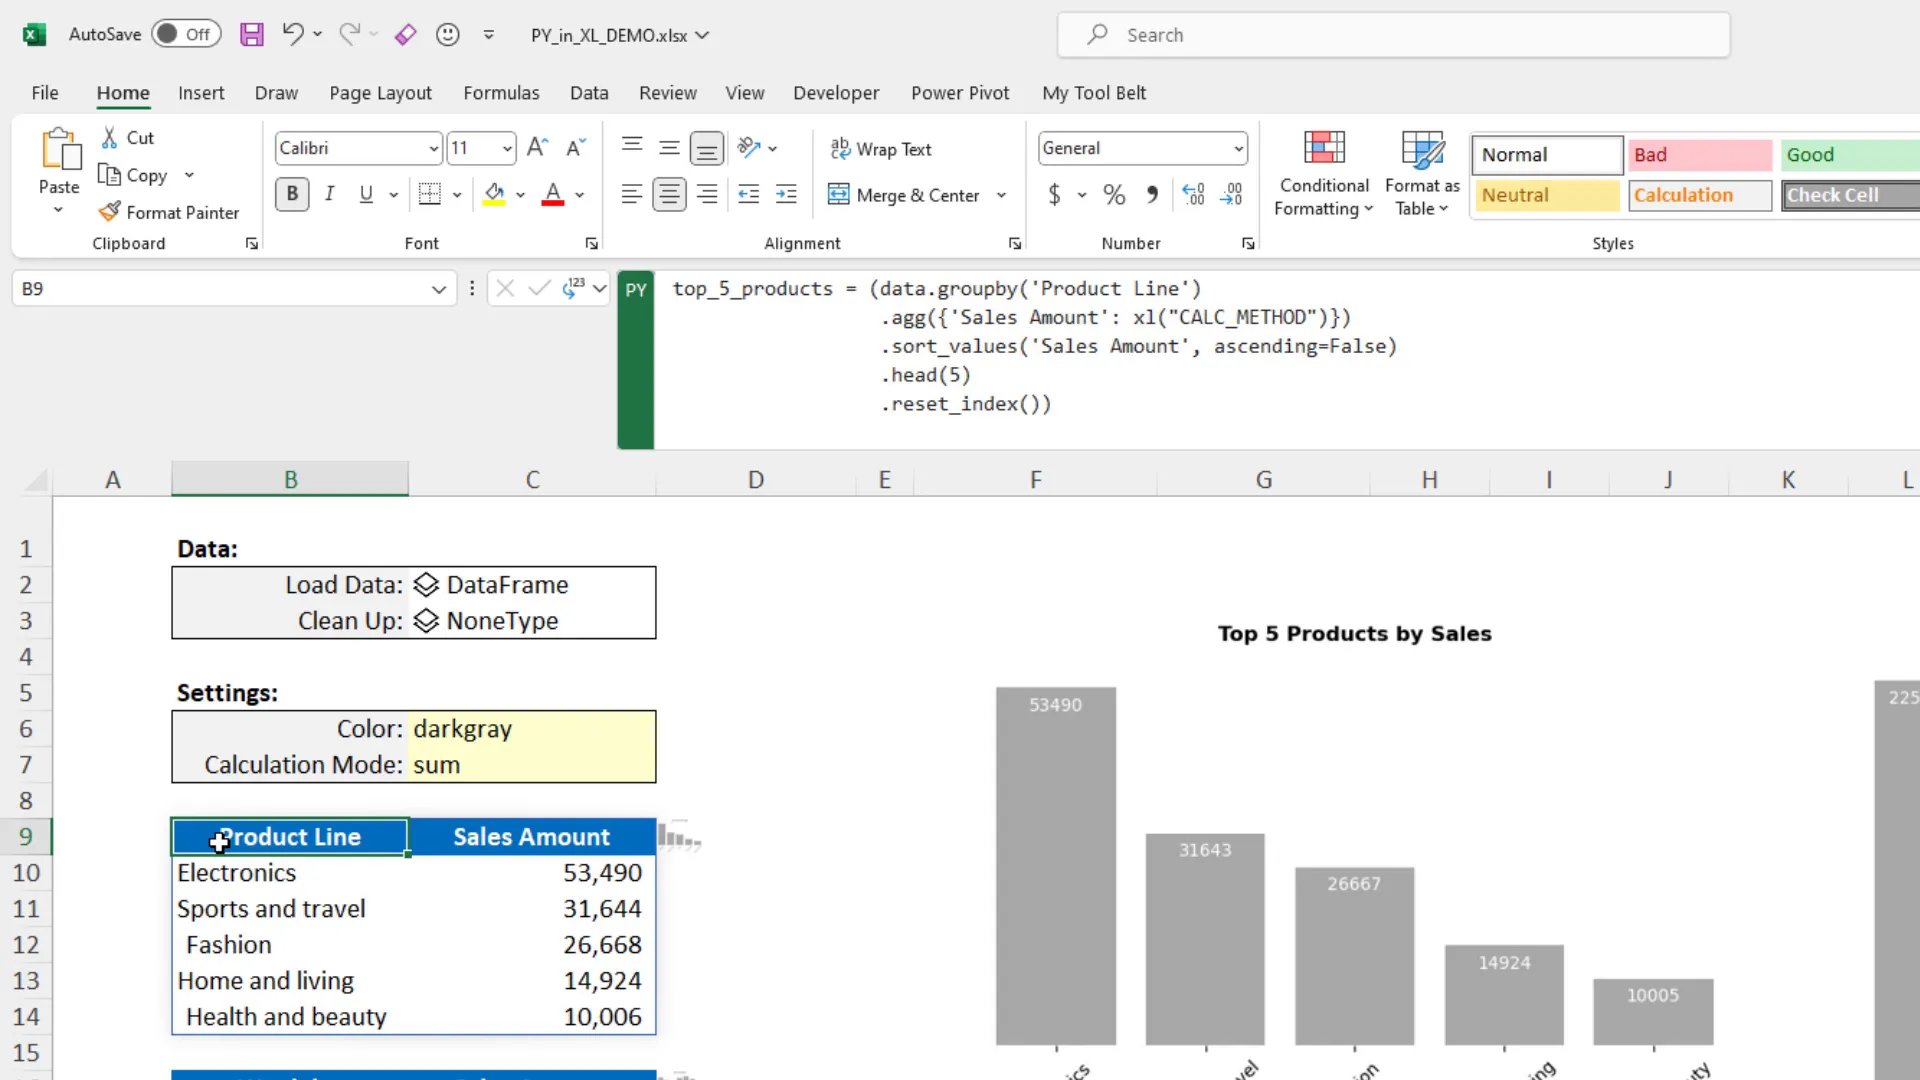
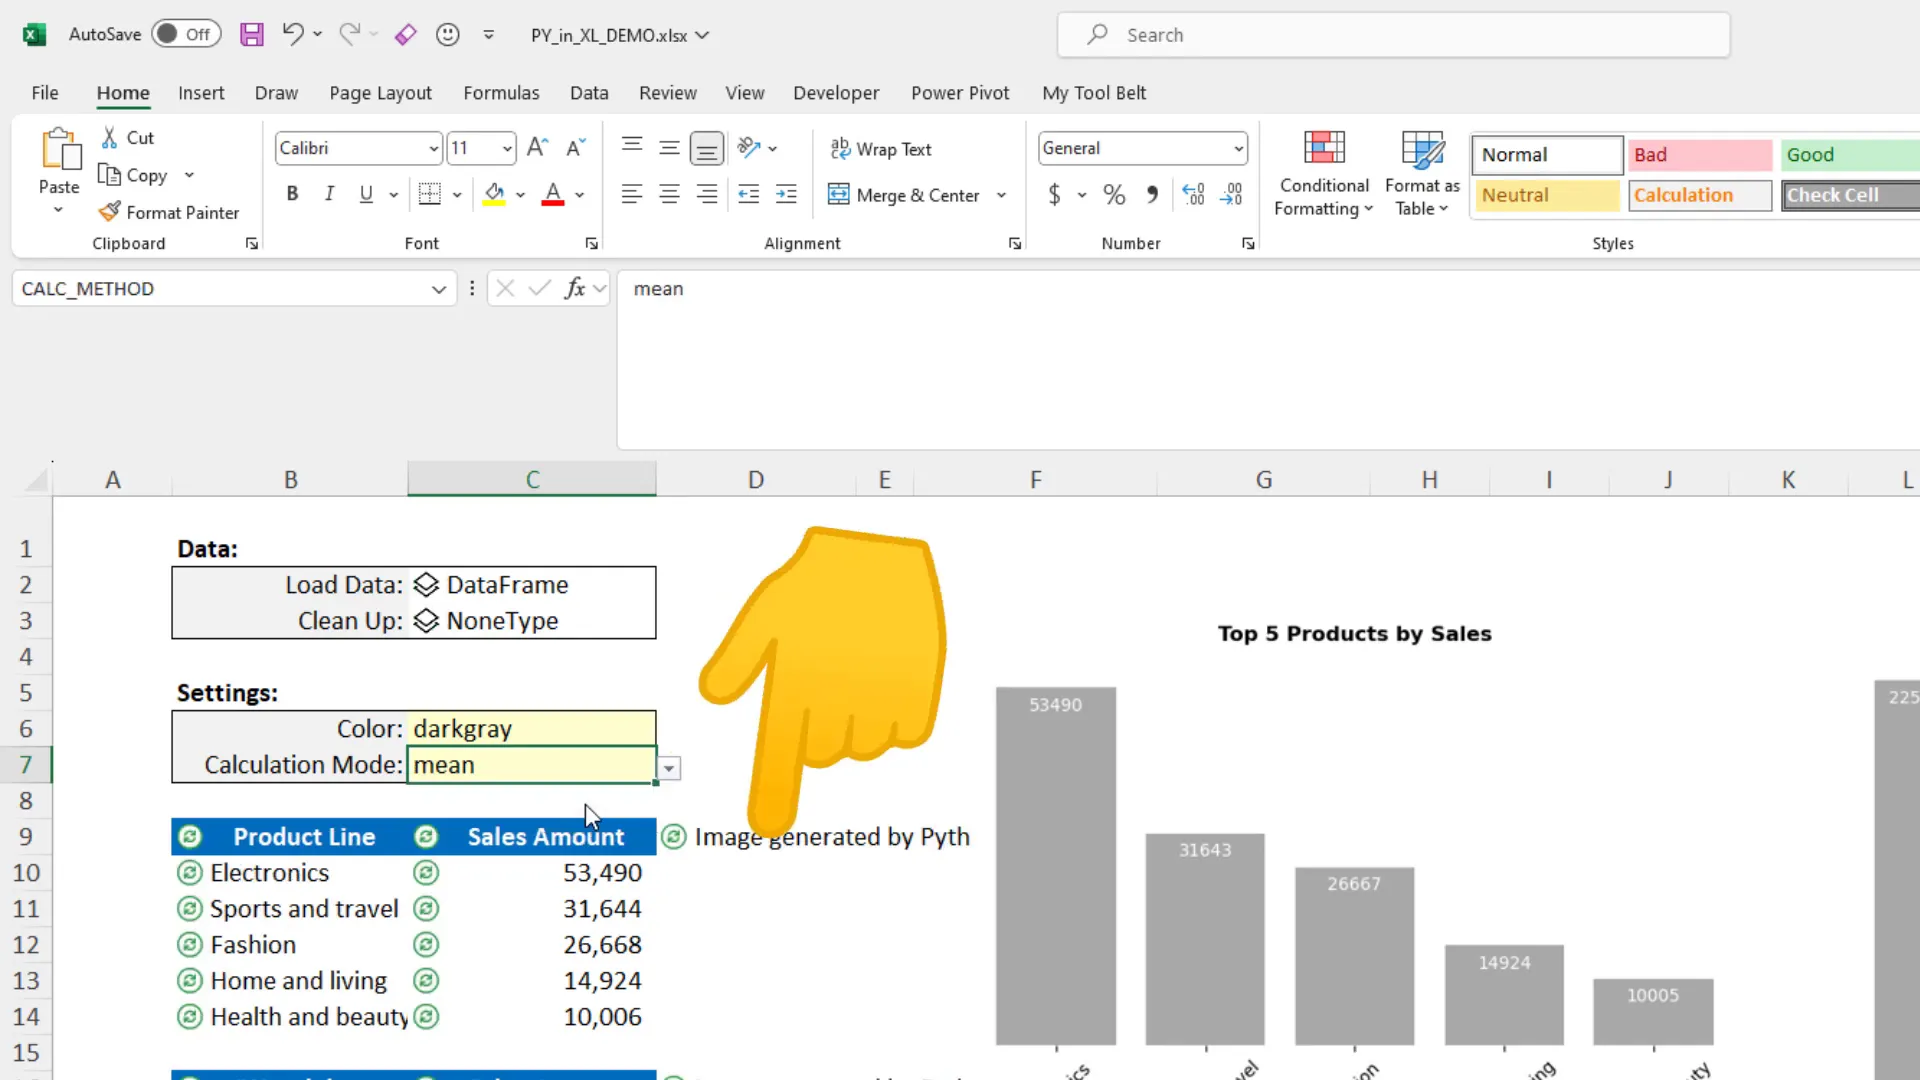
What’s cool here is that I linked the aggregation method to a cell with a drop-down menu, allowing flexibility in my calculations. Changing this value updates all related calculations and charts.
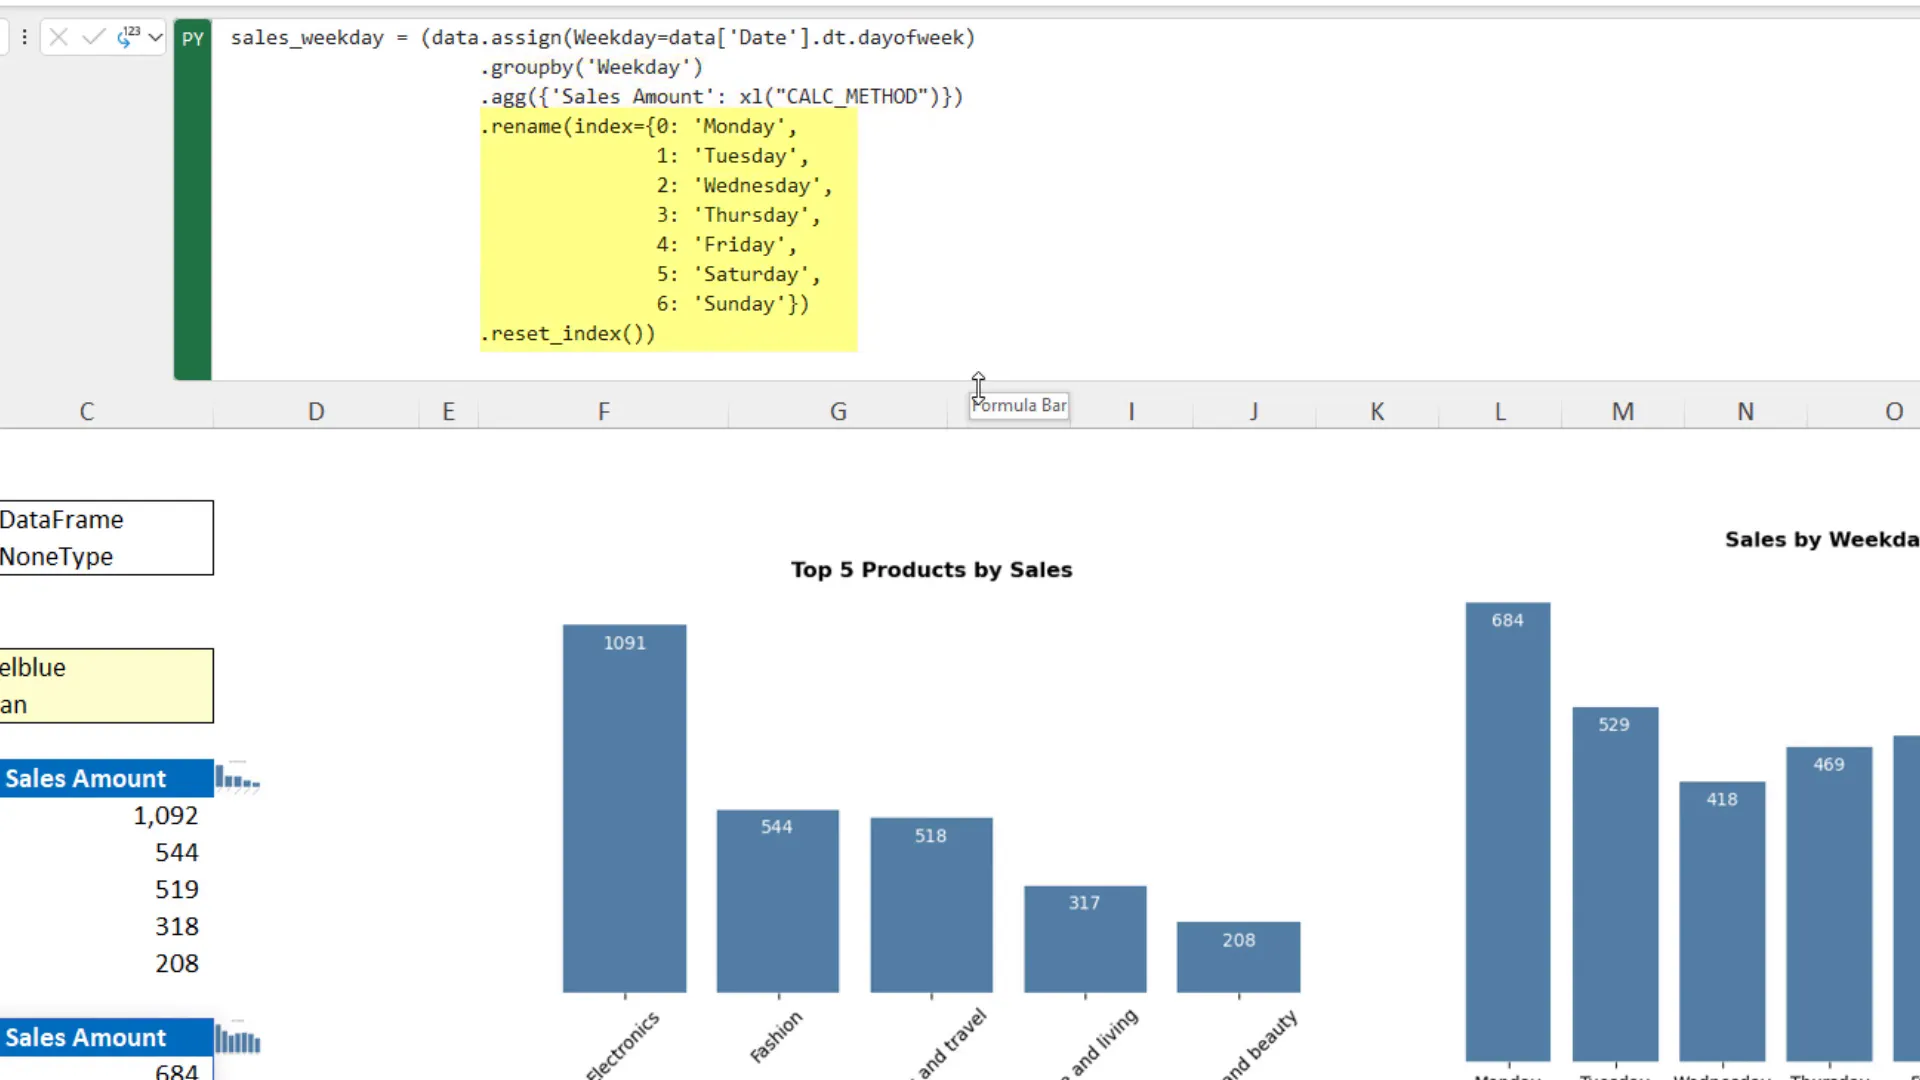
Next, I group the sales by weekday, using the assign method to extract the weekday from the date column. I aggregate the sales and reset the index to visualize the data.
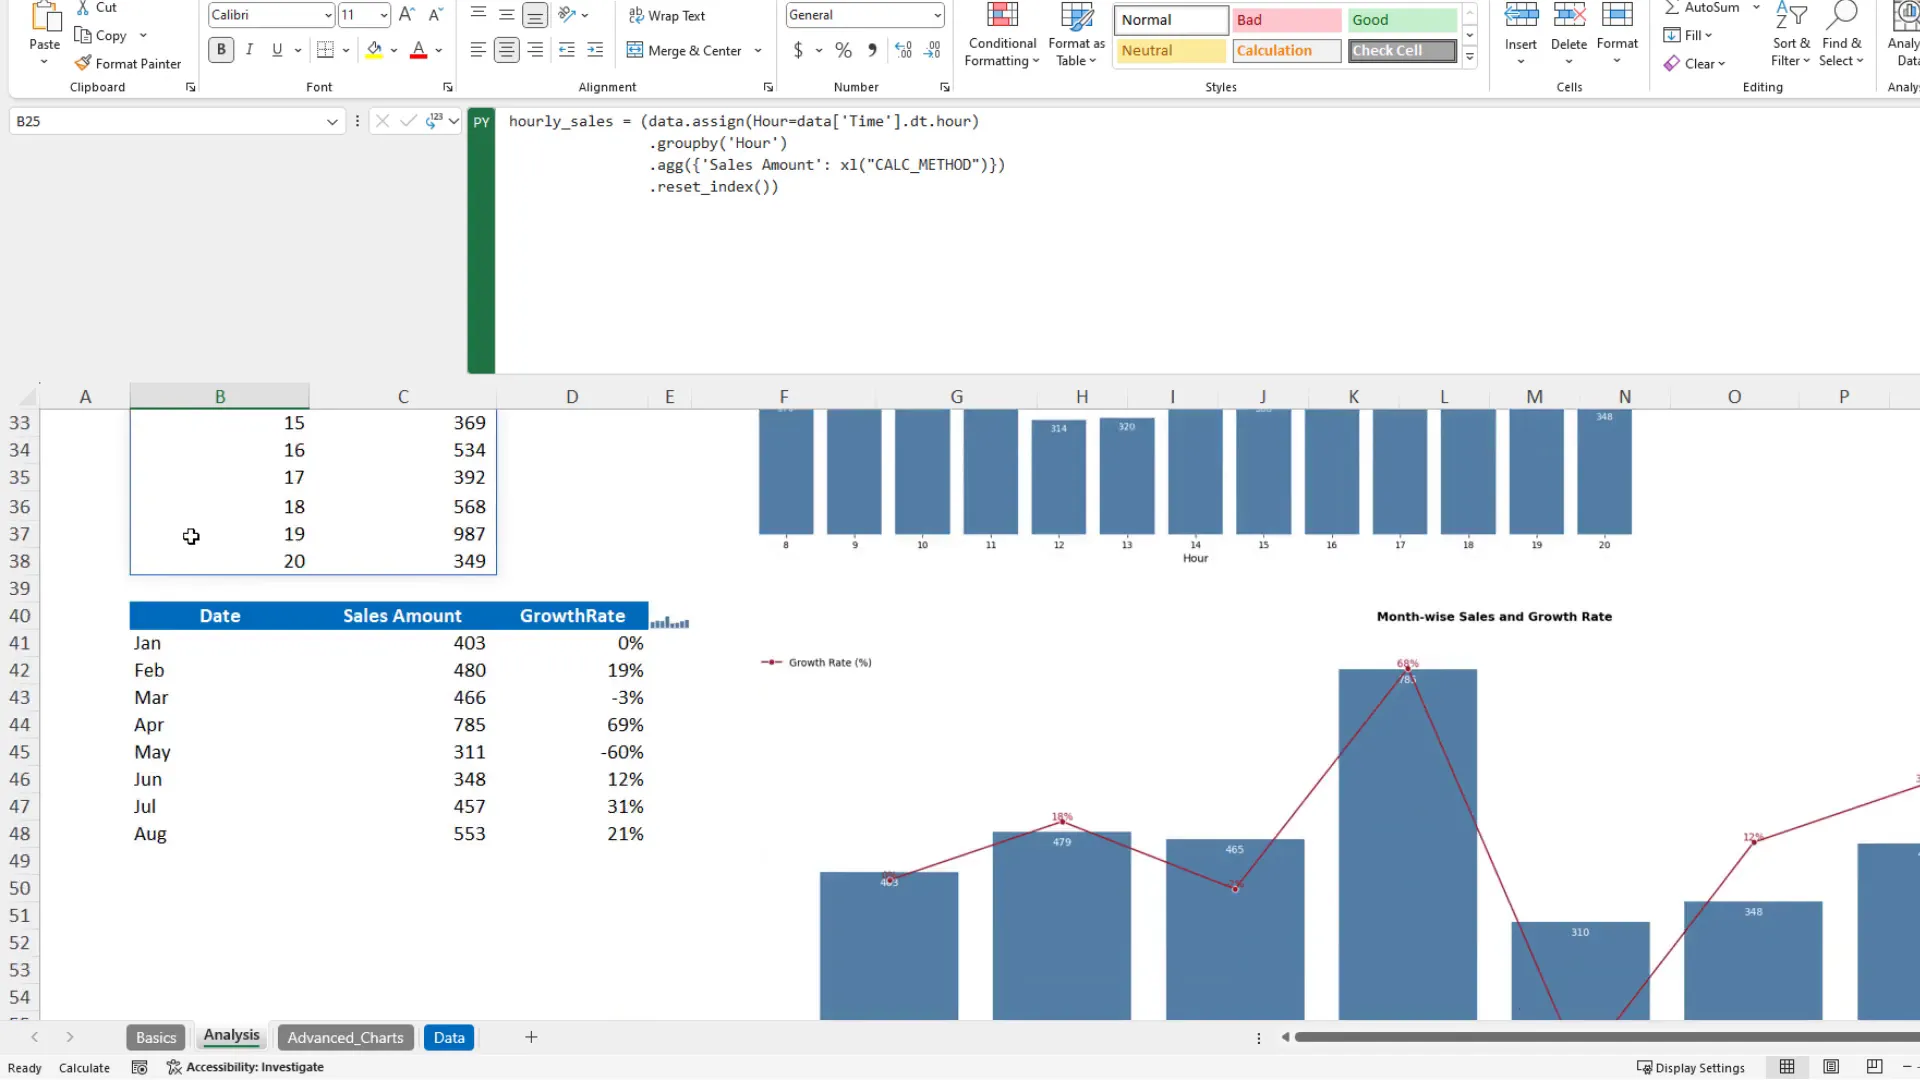
Then, I calculate sales by the hour, discovering that most customers shop after work hours. This insight could help in staffing decisions. I also calculate the month-over-month growth rate and create a chart to visualize it.
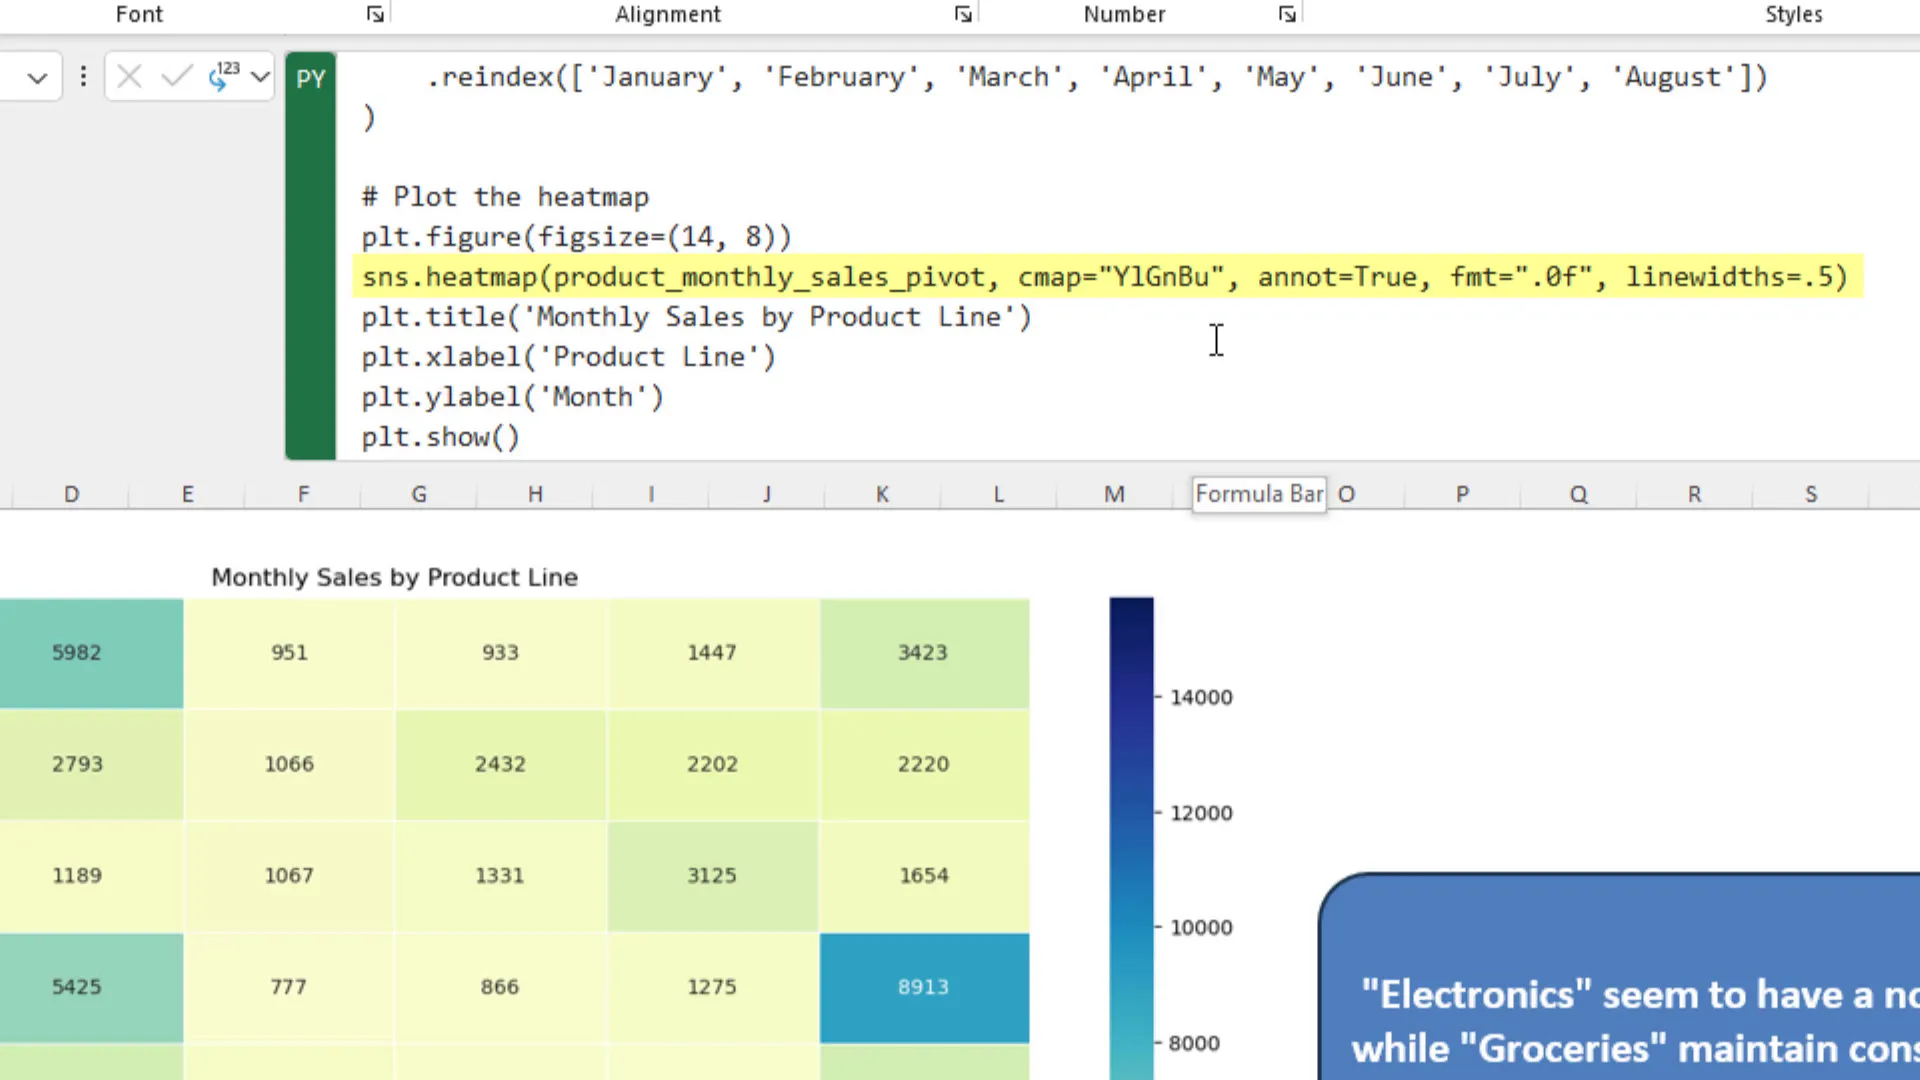
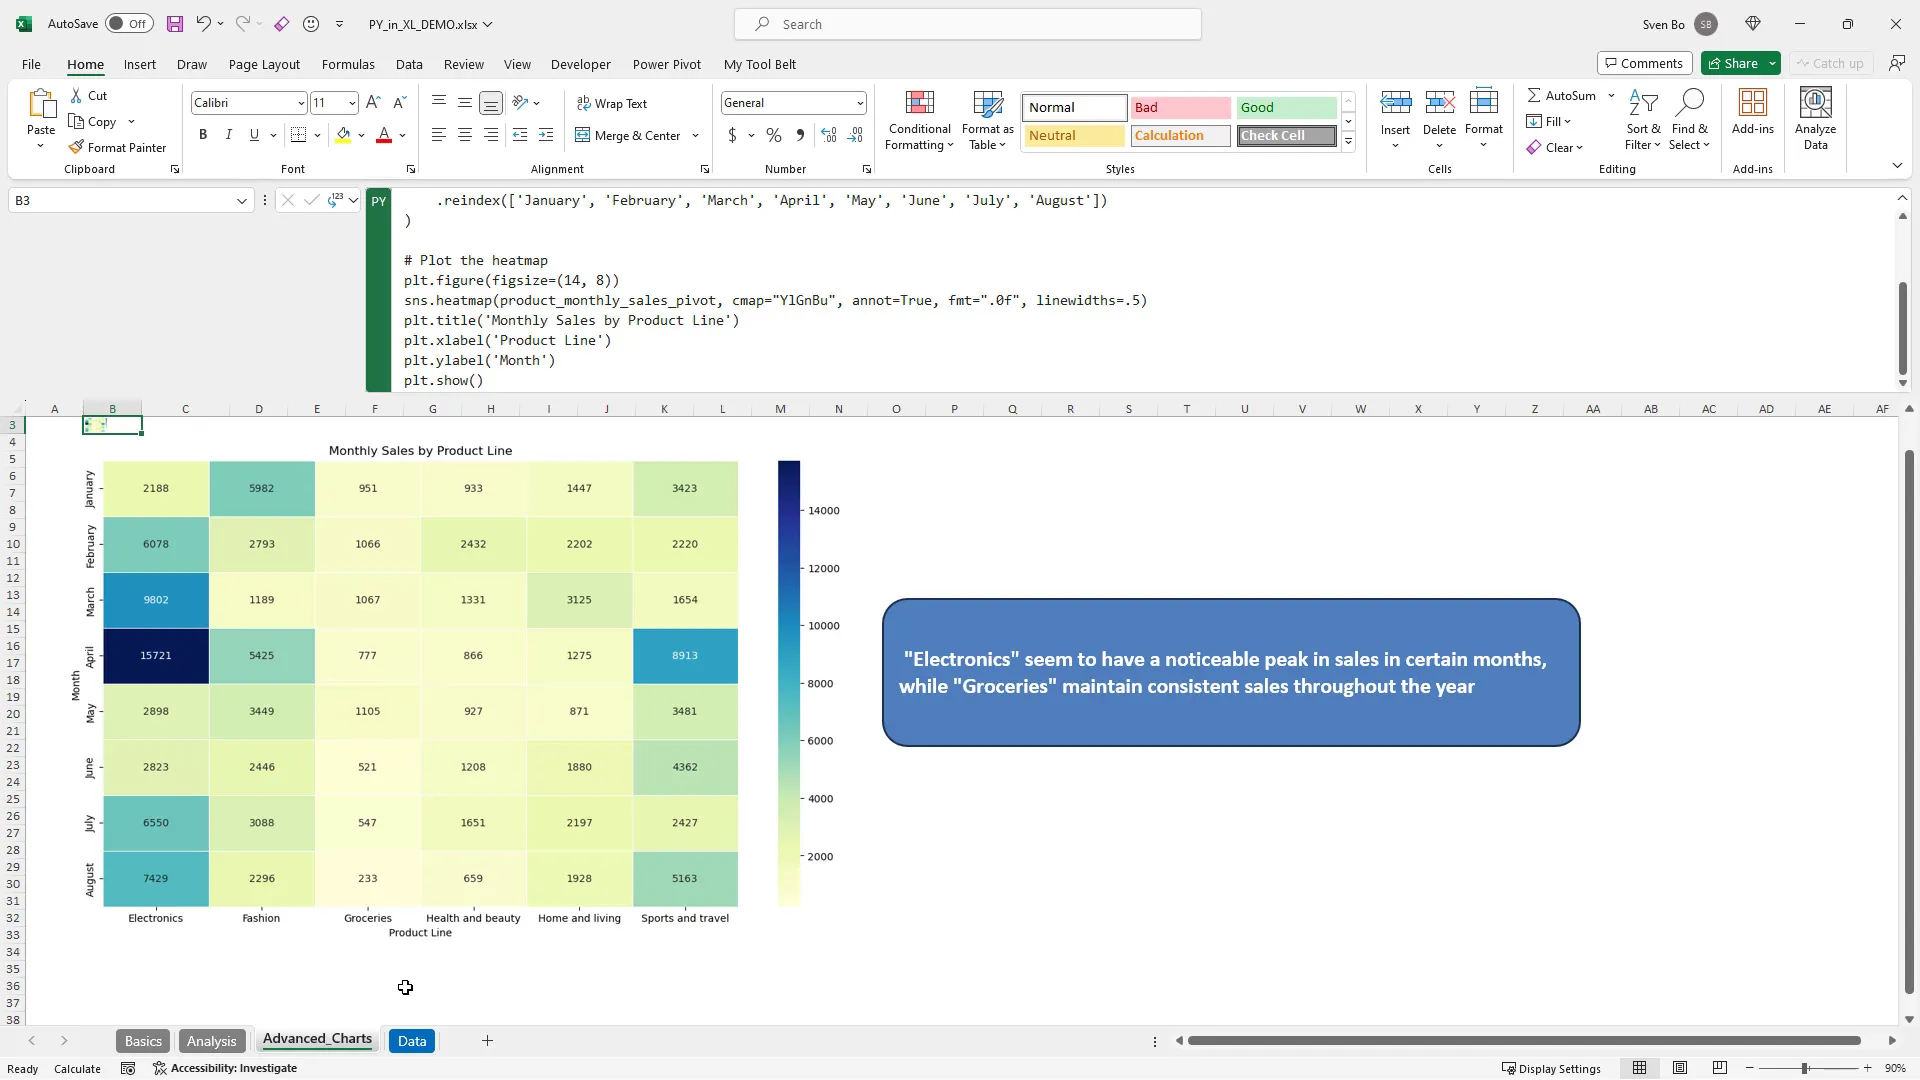
For more advanced visualization, I create a heatmap using a pivot table that displays sales amounts by product line and month. This chart provides deeper insights into sales trends.
Sharing My Thoughts on Python in Excel
Overall, integrating Python into Excel is a fantastic addition, providing another tool in the data analysis toolbox. While Python simplifies certain calculations, especially with dates and times, Excel’s PowerQuery also offers powerful data cleaning and aggregation capabilities.
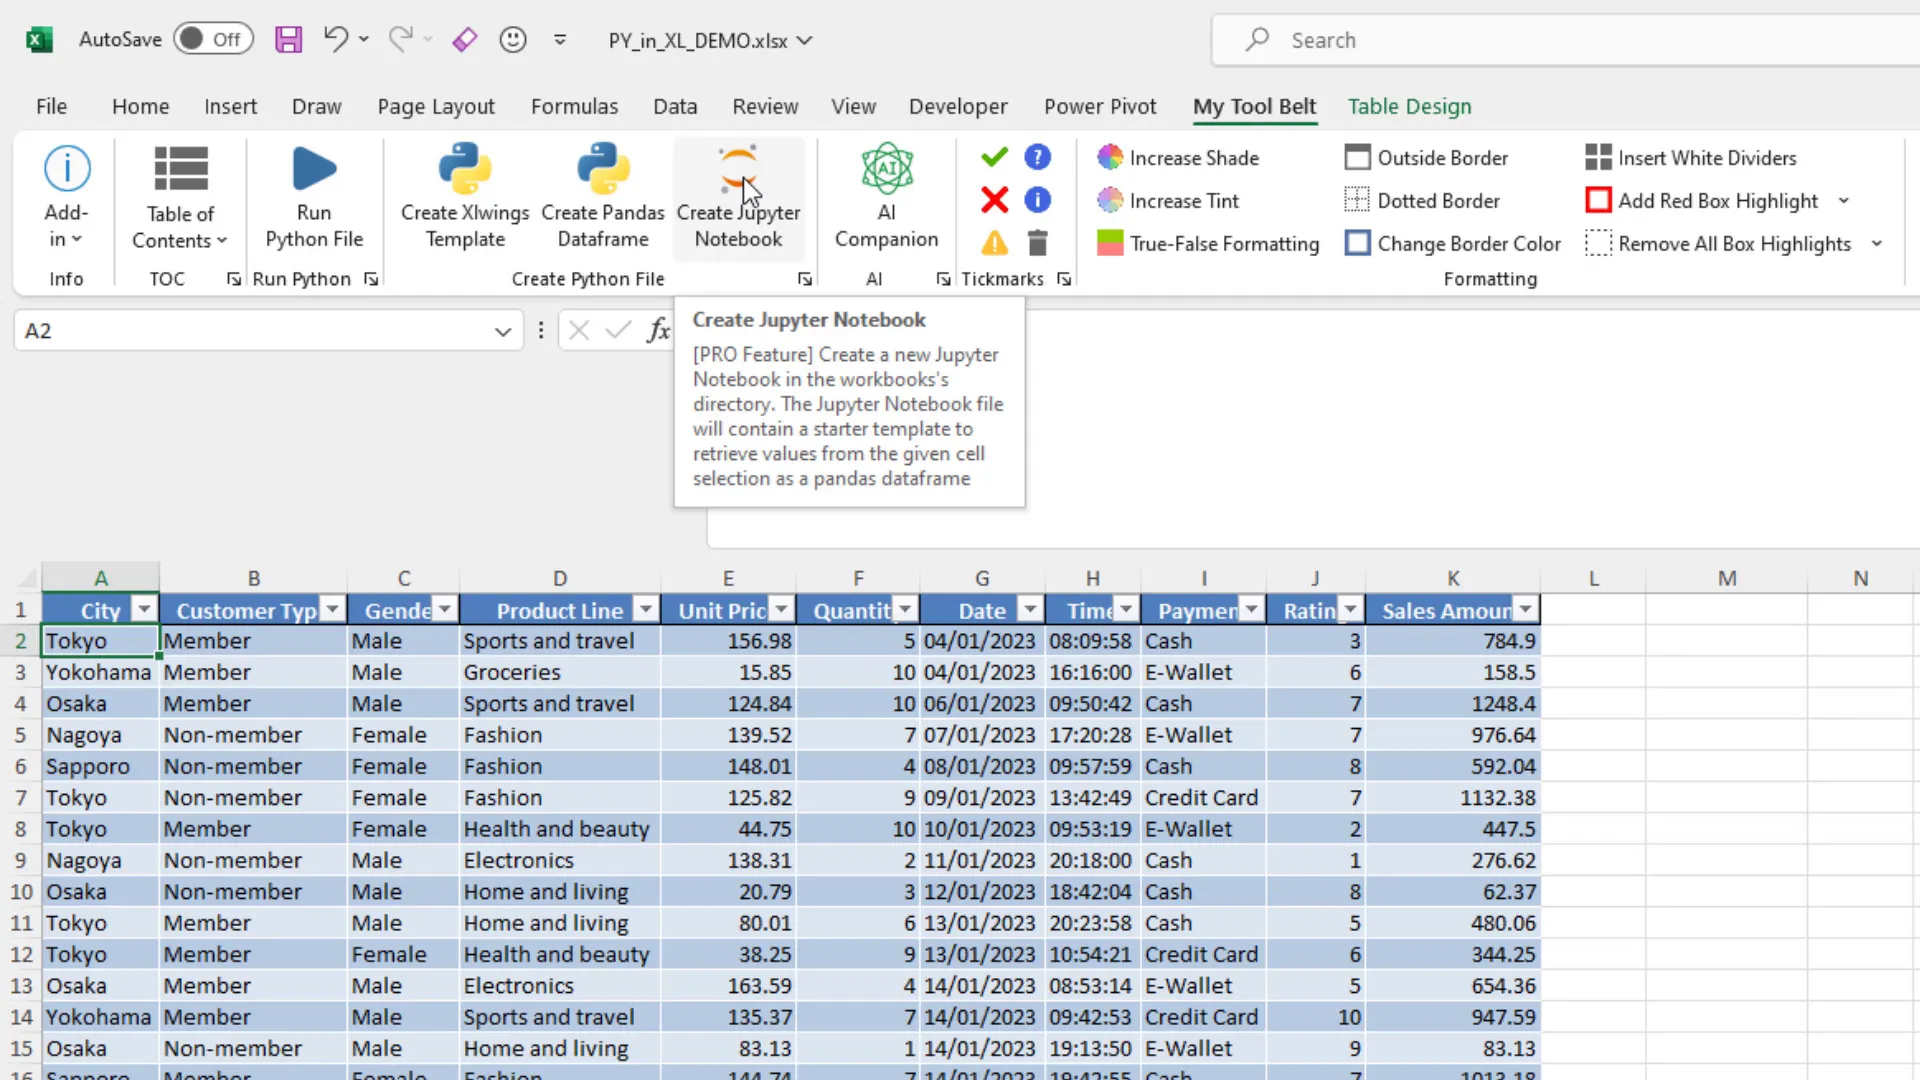
However, I’ve noticed that the more Python calculations I include, the slower the spreadsheet becomes. For exploratory data analysis, I prefer using a Jupyter Notebook for its flexibility and efficiency. I also created an add-in called “MyToolBelt” to streamline the process of transferring data from Excel to Jupyter.
Discussing the Limitations of Python in Excel
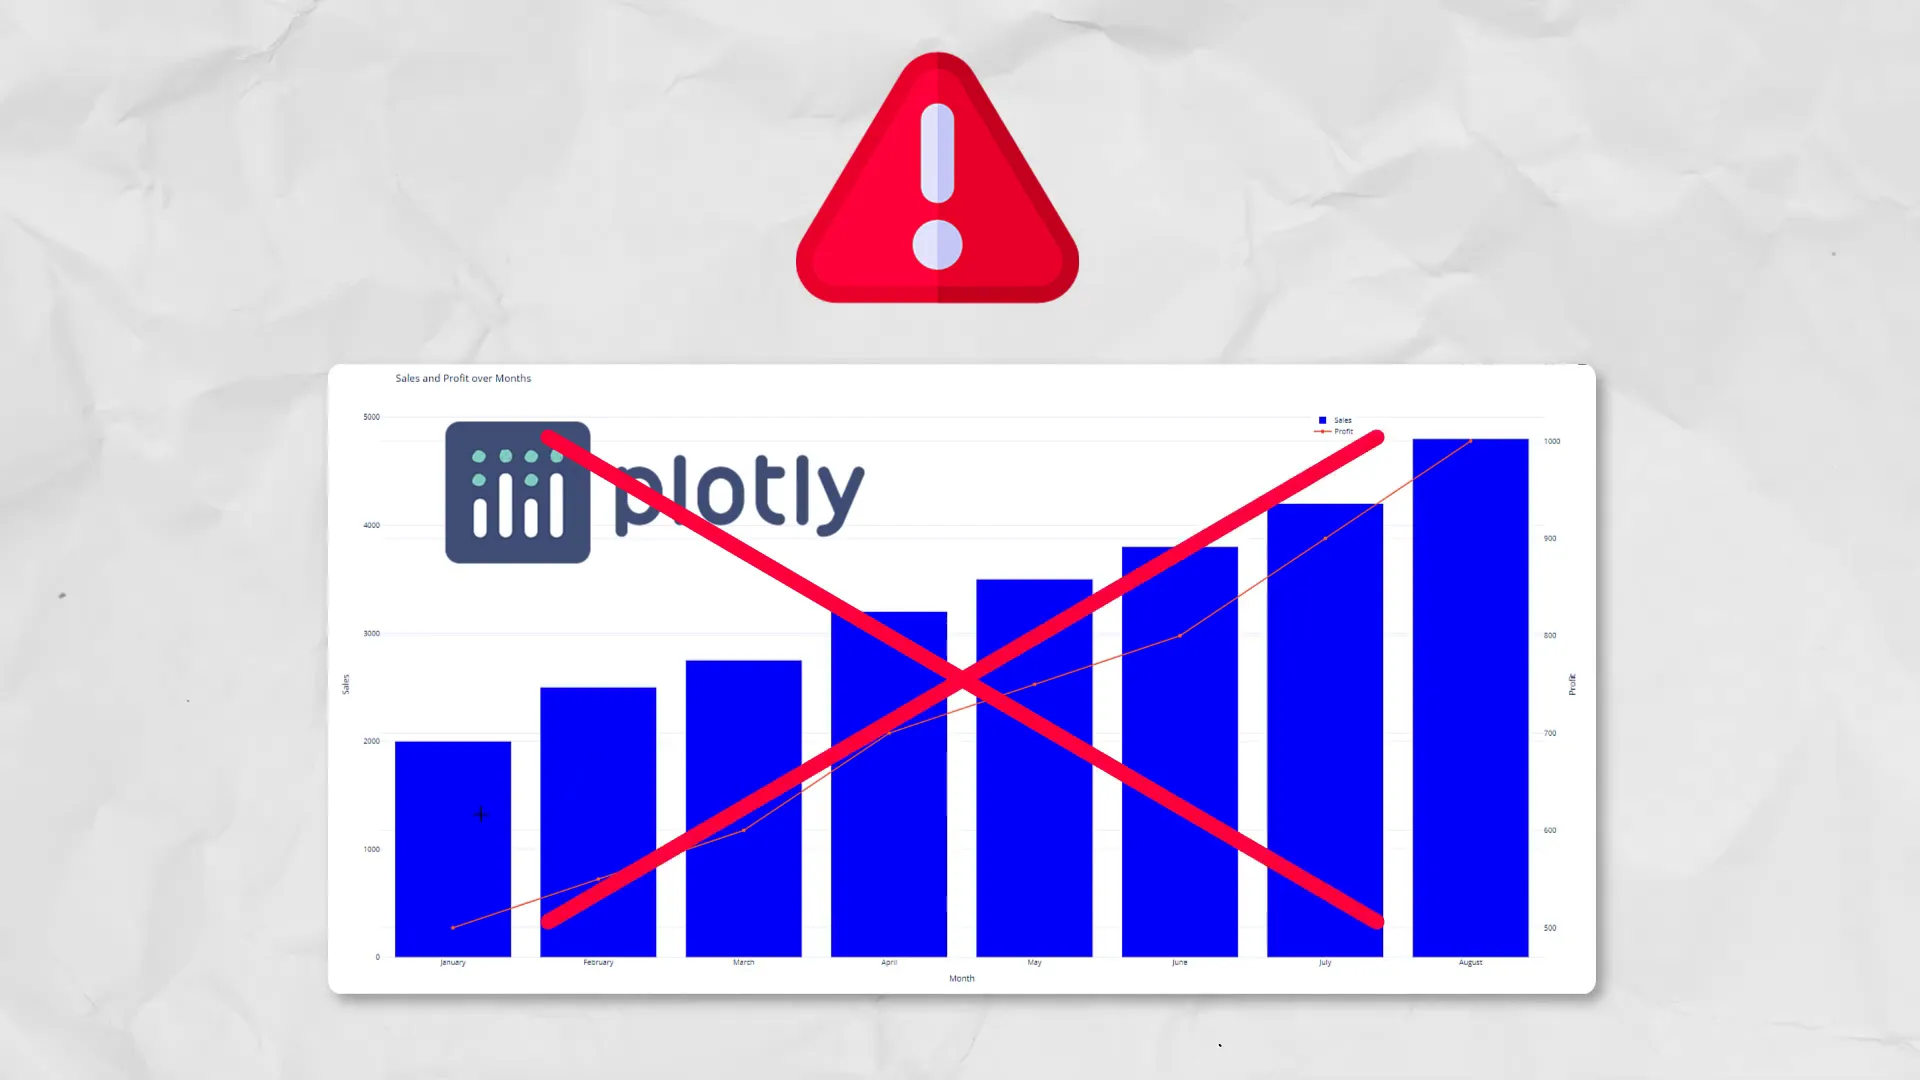
Despite the benefits, there are limitations to consider. Currently, animated Python charts like those from Plotly aren’t supported, and this functionality is exclusive to Excel Desktop 365 Beta Channel users on Windows. Additionally, connections to external files using Python are not possible; PowerQuery must be used instead.
Only libraries supported by Anaconda are available, so third-party packages outside this distribution cannot be used.
Outro
In conclusion, the integration of Python into Excel is an exciting advancement that enhances data analysis capabilities. It allows for more flexible and powerful data manipulation, although it comes with some constraints. I encourage you to explore this feature and share your thoughts on it!