Turn Your Excel Worksheet Into An Exploratory Data Analysis Report In Just 3 Lines Of Python Code

Introduction
In this tutorial, I will showcase how you can perform exploratory data analysis (EDA) using the Python library Pandas Profiling. This tool allows you to generate comprehensive reports from your datasets in just three lines of code. Imagine transforming your Excel workbook into an interactive HTML report that gives you insights into missing values, distributions, correlations, and descriptive statistics like mean and standard deviation.
Getting Started
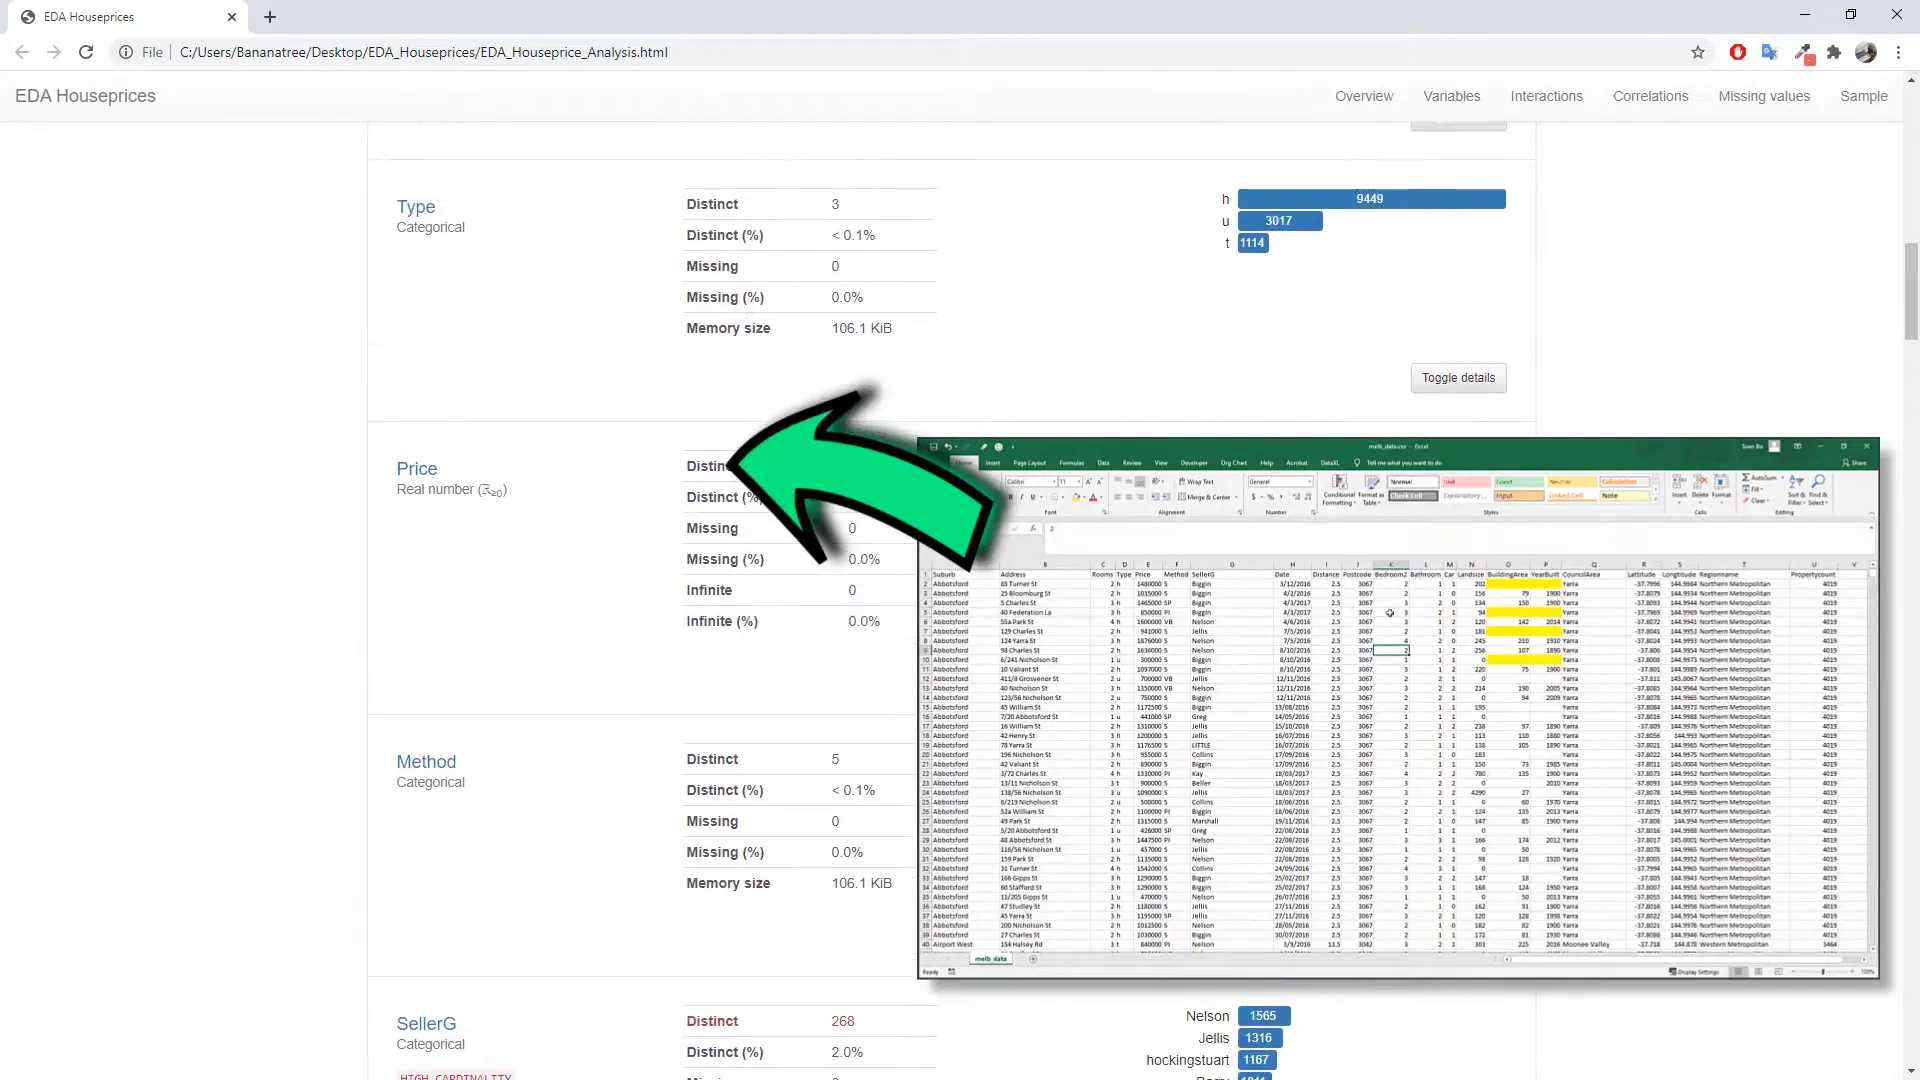
When you receive a new dataset, such as the housing prices in Melbourne from Kaggle, one of the first steps is to explore the data. You might want to check for missing values, understand how the values are distributed, and see if there are correlations between different variables. Typically, users apply filters or create pivot tables and charts to analyze the data. However, with Pandas Profiling, you can generate a complete summary of your data effortlessly.

Python Code
To get started with Pandas Profiling, you first need to ensure you have Python installed on your machine. If not, there are many tutorials available to guide you through the installation process.
Once Python is set up, create a new Python file and follow these steps:
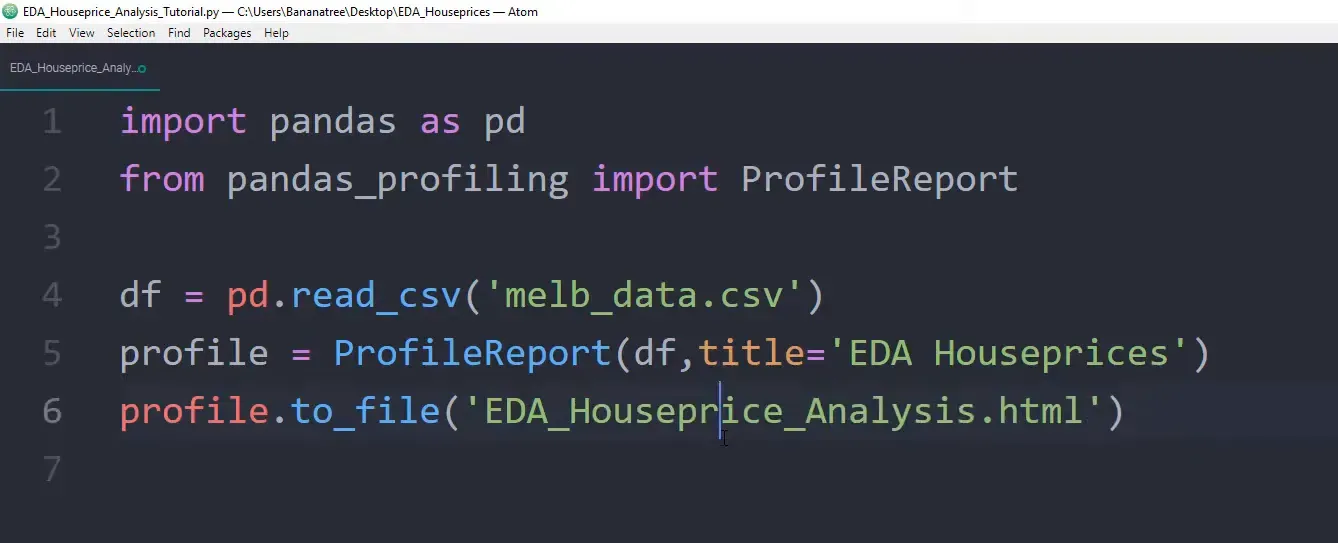
- Import the necessary libraries:
import pandas as pd
from pandas_profiling import ProfileReport- Install the required libraries via command prompt:
pip install pandas
pip install xlrd
pip install pandas-profiling- Load your dataset into a Pandas DataFrame:
df = pd.read_csv('melb_data.csv')- Generate the profiling report:
profile = ProfileReport(df, title="EDA House Prices")
profile.to_file('EDA_Houseprices_Analysis.html')
After executing this code, you’ll have a new HTML file with a detailed EDA report.
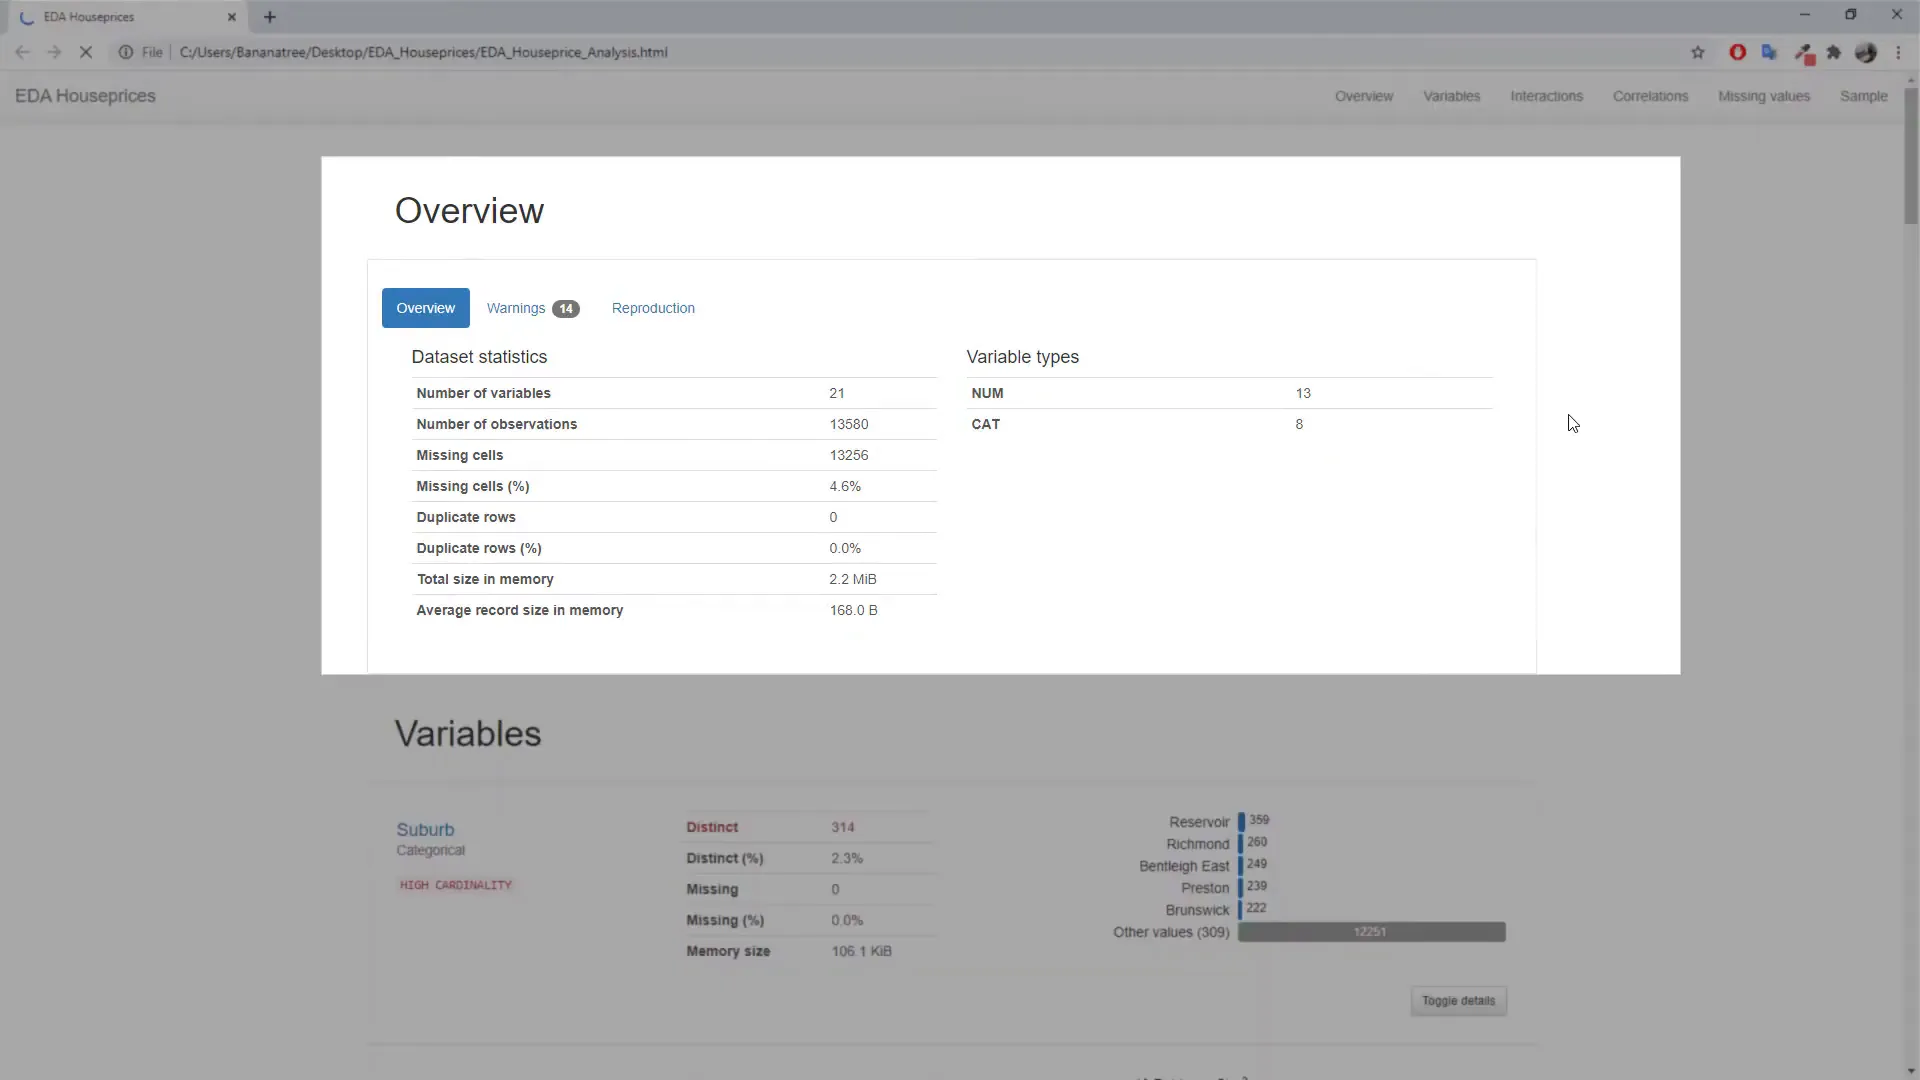
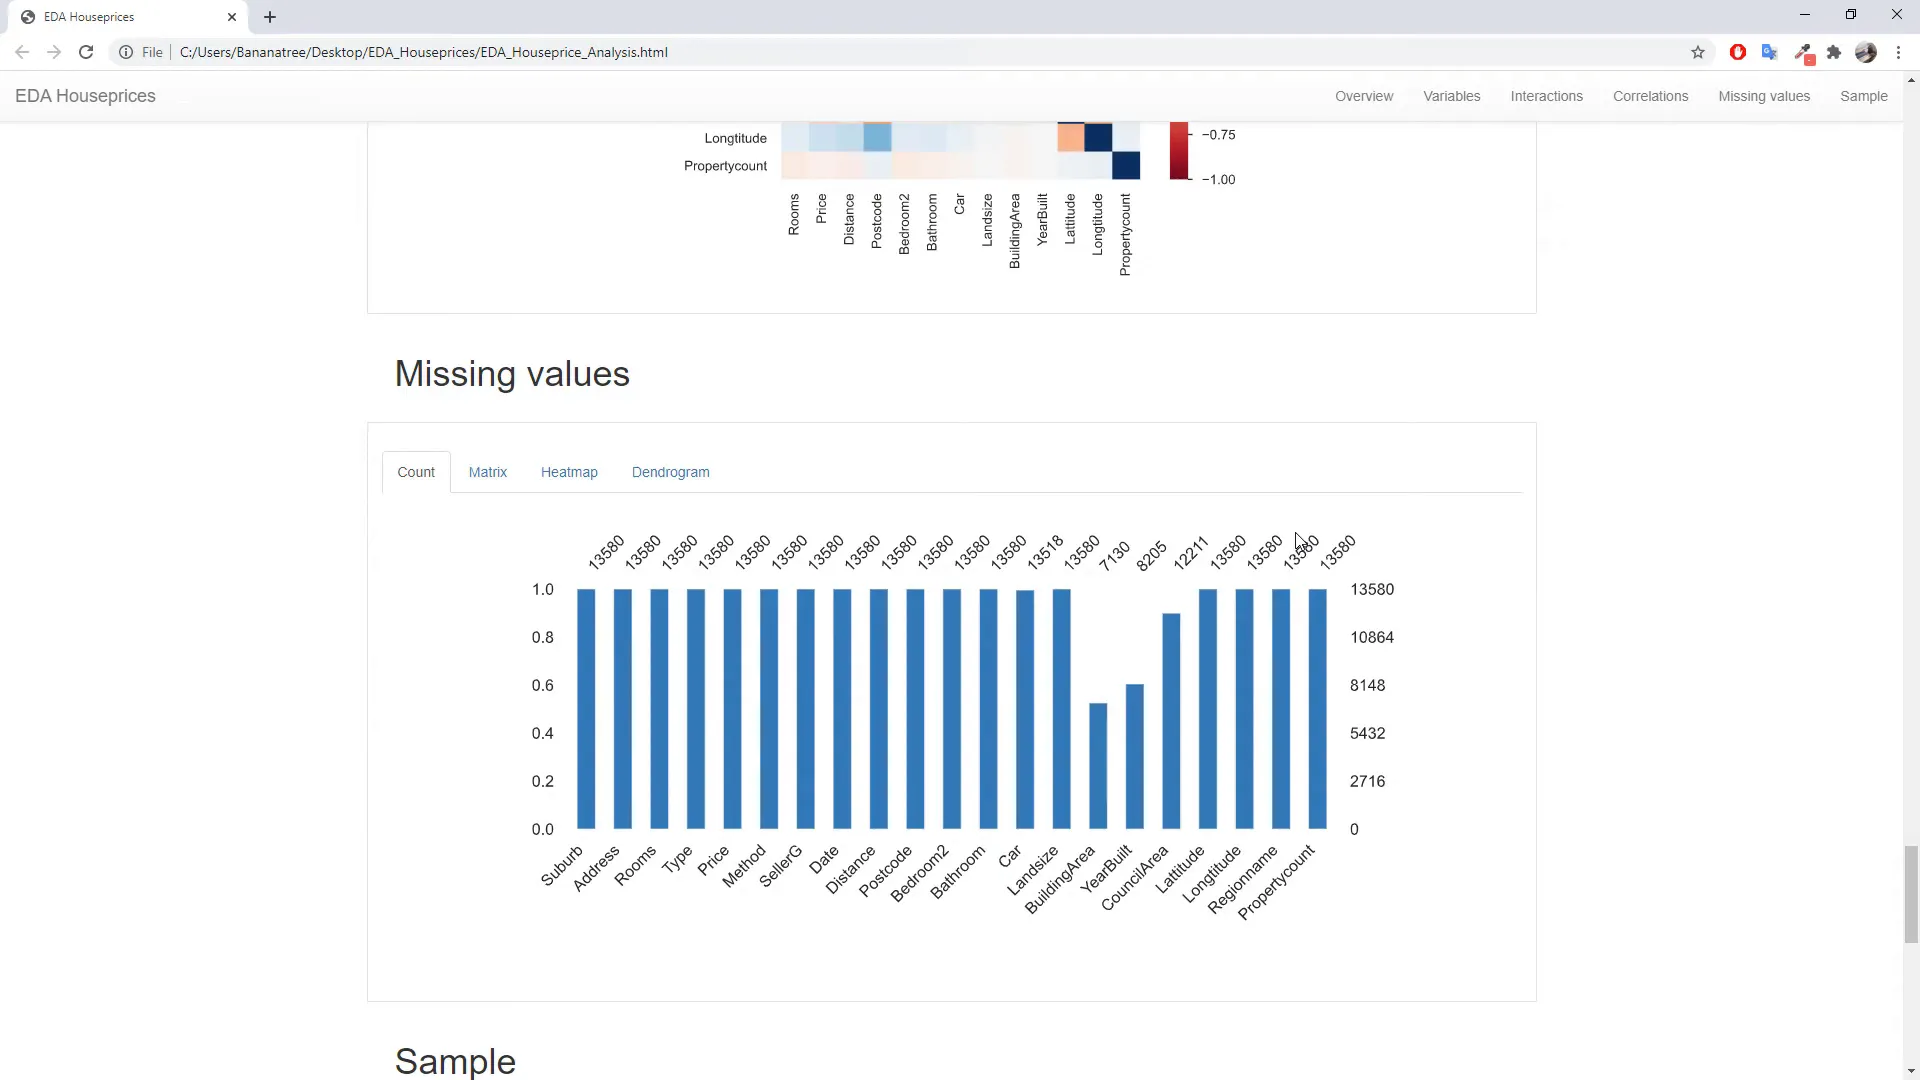
Upon opening the generated report, you’ll find a comprehensive overview, including the number of columns, rows, duplicates, and missing values. The report also highlights any warnings, such as high cardinality in certain columns or potential correlations.
For each column, you will get a quick overview of unique values, missing values, and their distribution. Numerical columns will display a histogram, while categorical columns will show count plots. The report even includes a correlation heat map to identify relationships between variables, such as house prices and the number of rooms.
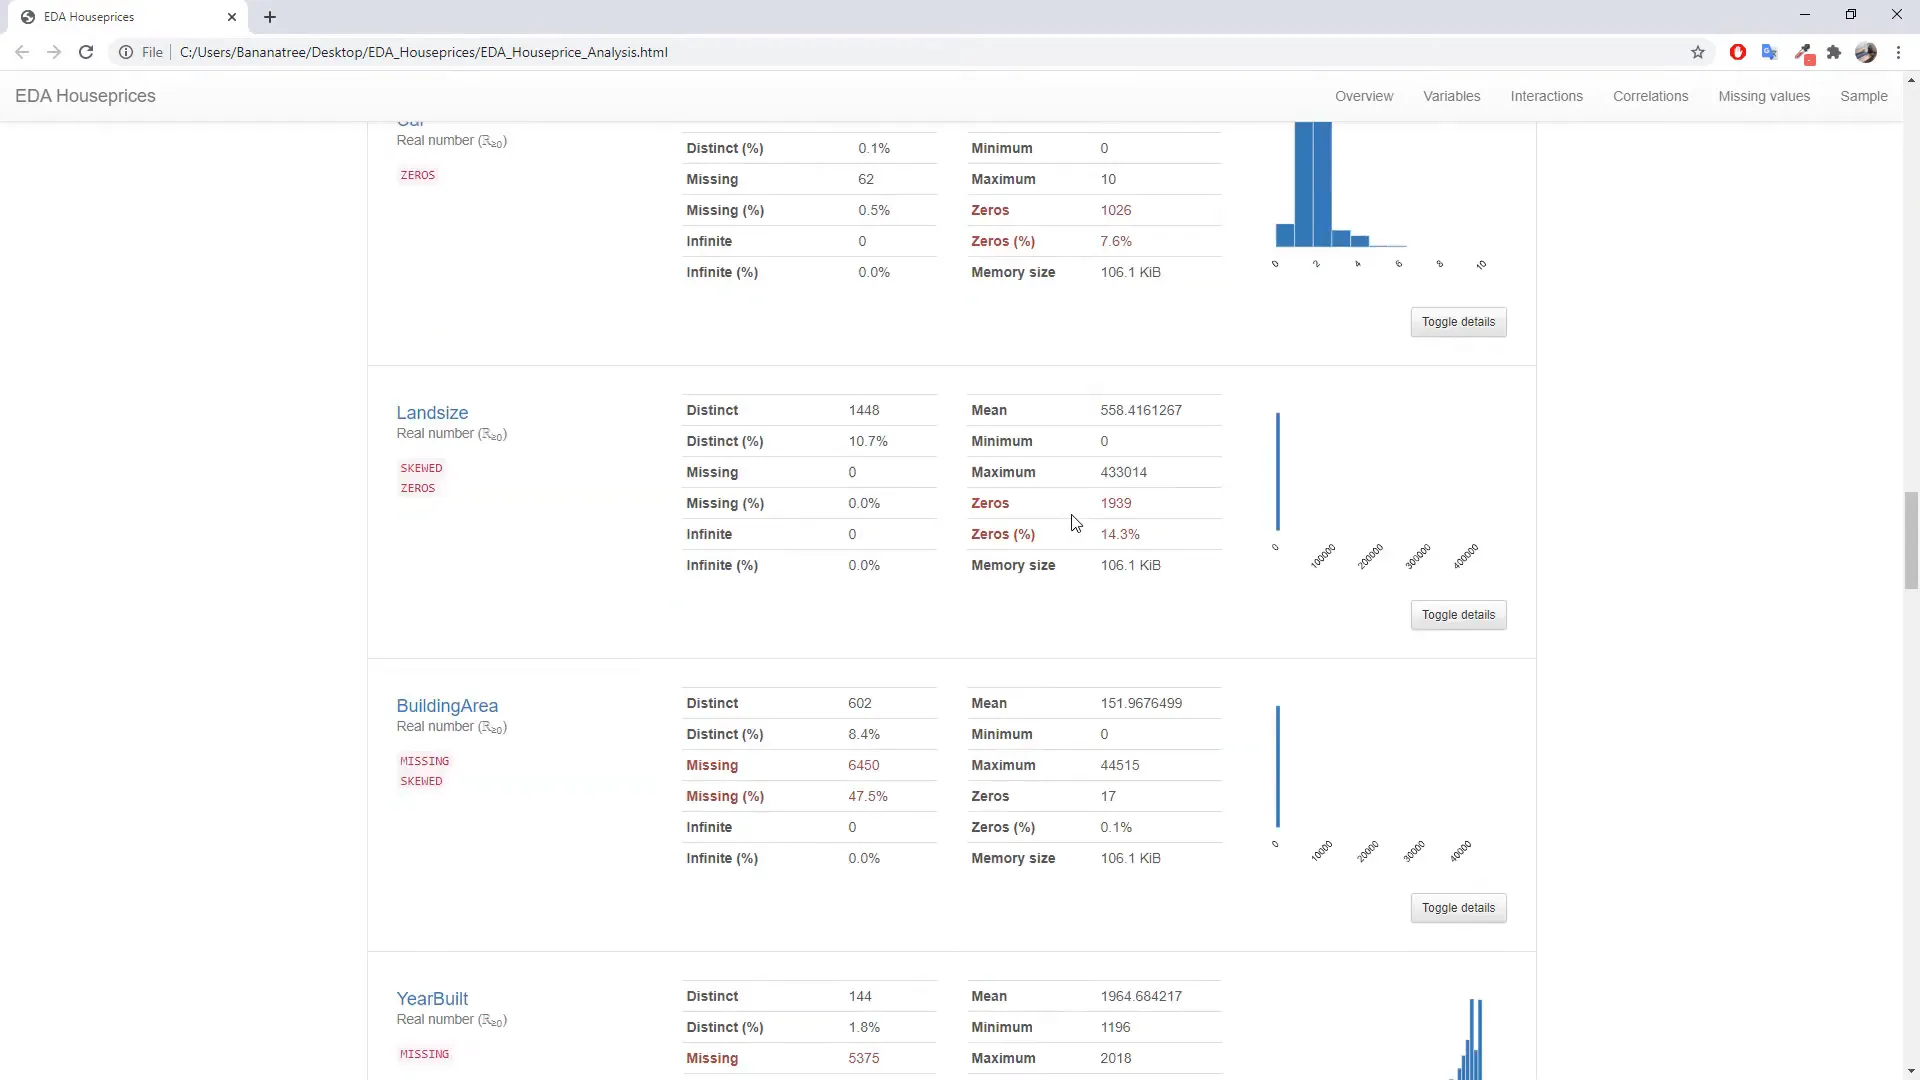
Additionally, the report provides a missing values overview, helping you understand which columns require attention. For instance, you might notice that 40-50% of data for certain attributes like “building area” is missing.
Outro
Pandas Profiling is a powerful tool for quickly generating exploratory data analysis reports. It automates many aspects of data exploration, providing insights that can help guide further analysis and data cleaning efforts. For more information about this library, you can visit the official GitHub page linked below.