Create Gantt Charts in Excel with Dependencies and Milestones

Create Gantt Chart in Excel: One-Click, Interactive, and Shareable
Imagine you need a clear timeline for a project but dread wrestling with bar charts, nested formulas, or templates that collapse as soon as a date changes. If that sounds familiar, this guide shows how to Create Gantt Chart in Excel quickly and reliably using a one-click add-in that turns a normal table into an interactive timeline.
Why build a Gantt chart this way?
Traditional methods to Create Gantt Chart in Excel often mean hours of fiddling: stacked bar charts, conditional formatting rules, or brittle templates. The approach here treats your table as the single source of truth and exports a tiny interactive HTML file that anyone can open in a browser. No formulas to break, no Excel version lock-in for viewers, and the file stays offline on your machine until you choose to share it.
What you need before you start
- Excel desktop (Windows or macOS; web version not supported)
- A simple table with at least four columns
- The add-in installed (one-time setup)
Table structure: keep it simple
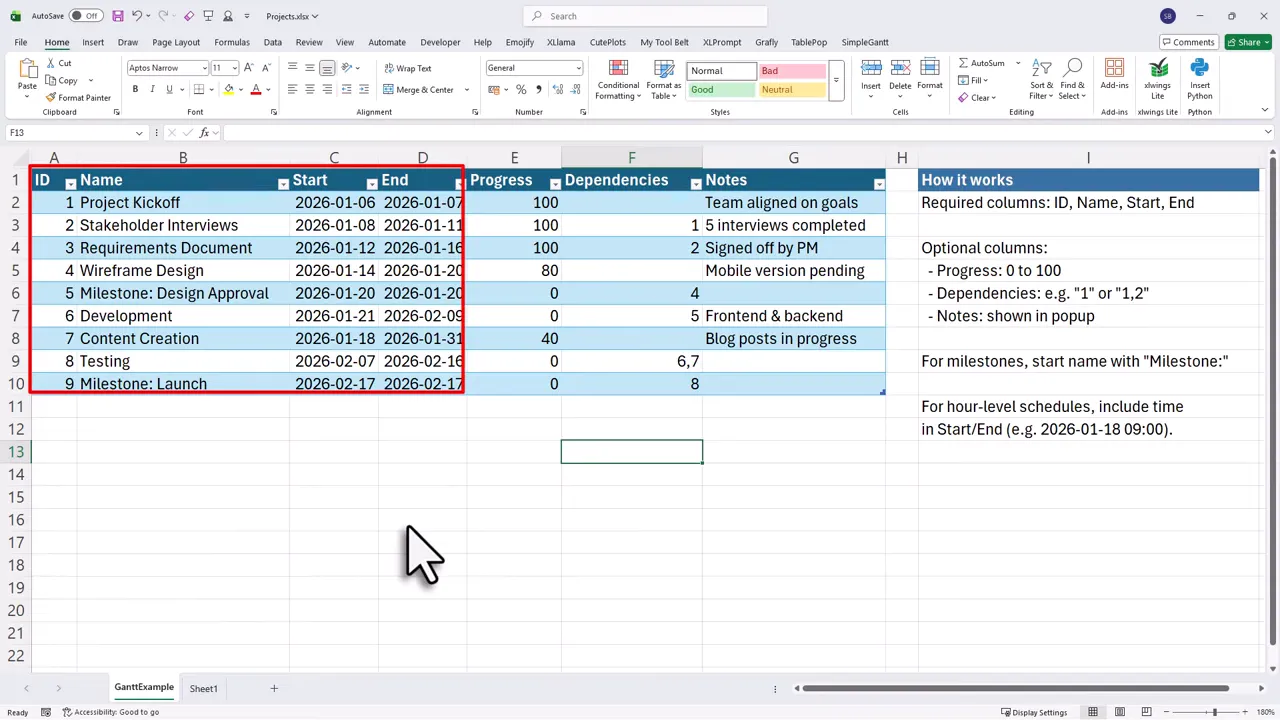
To Create Gantt Chart in Excel you only need a standard Excel table with these four columns:
- ID
- Name
- Start
- End
Optional columns include Progress, Dependencies, and Notes. To mark milestones, prefix the task name with the word milestone (this keyword is configurable).
One click export: from table to interactive timeline
Once your table is ready, use the add-in menu and click the export button. The add-in saves a compact HTML file (around 7 KB) into your workbook folder. Open that file in any browser to see a fully interactive Gantt chart built from your table.
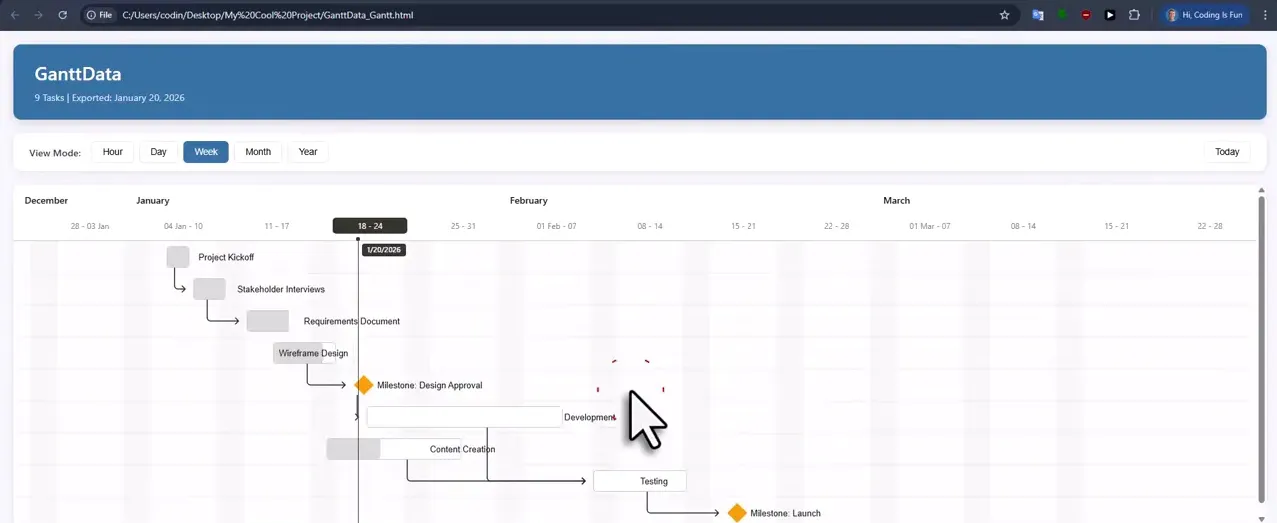
Click any task on the chart to see exact start and end dates, progress, dependencies, and the notes pulled directly from your table. Dependencies are visualized with arrows, and tasks with progress show a shaded fill to indicate completion level.
Hourly timelines and meeting agendas
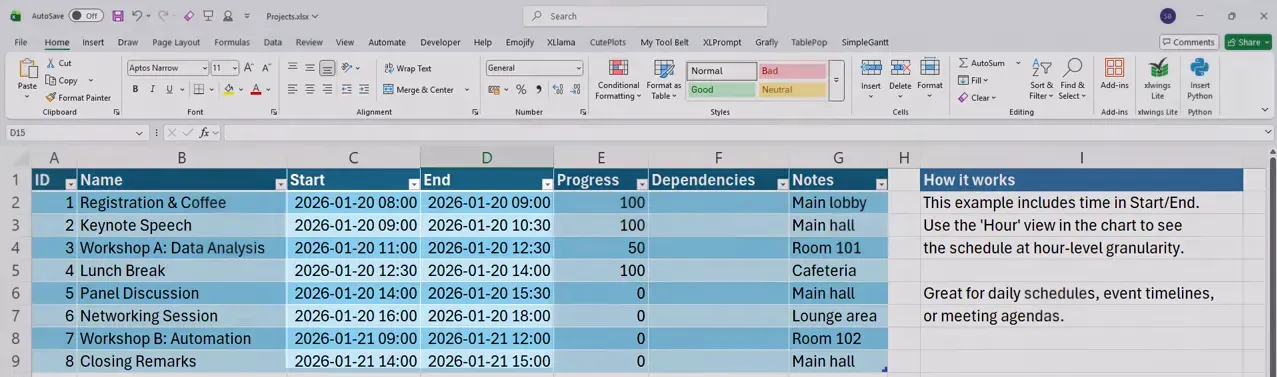
The same table format works for hourly schedules. Add specific times to your Start and End columns and export again. Switch the chart view to hour to display tasks on an hourly grid—useful for daily schedules, event timelines, and meeting agendas.
Customization and branding
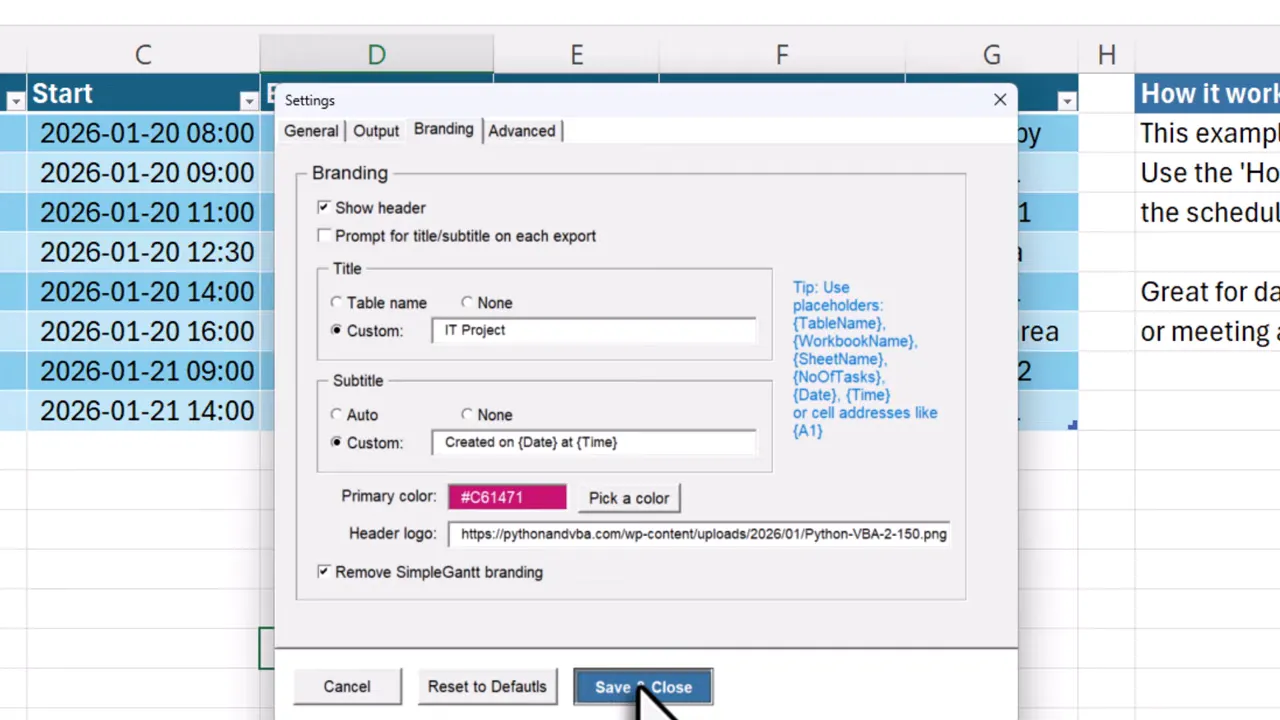
Before exporting, tweak settings to match your needs. You can:
- Change the milestone keyword
- Adjust appearance and default chart view
- Switch language (multiple languages supported)
- Set output location and file name
- Customize titles, subtitles, and include placeholders like workbook name or number of tasks
- Set the primary color with hex or RGB and add a header logo
How the export keeps things safe and simple
The export process runs locally on your computer. That means the exported file works offline and no data leaves your machine unless you attach or upload the HTML yourself. The file opens without Excel, so recipients only need a browser to view the interactive chart.
Compatibility and licensing
- Works with Excel 2007 up to Excel 365 (desktop versions only)
- Runs on Windows and macOS
- Free version available for basic use; Pro is a one-time purchase for advanced features
Quick workflow summary
- Create a table with ID, Name, Start, End (add Progress, Dependencies, Notes if needed)
- Mark milestones by prefixing the Name with your milestone keyword
- Open the add-in and click Create Gantt
- Open the exported HTML in a browser and adjust view modes (day, week, hour)
- Use settings to brand and customize the chart
Final thoughts
If you need to Create Gantt Chart in Excel without wrestling with formulas or fragile templates, this one-click export approach keeps your data where it belongs—clean in a table—and produces a shareable, interactive timeline everyone can open. It turns a tedious task into a pleasant one (or at least less painful), and the ability to customize branding and view modes makes the charts useful for anything from multi-month projects to one-day agendas.
If you try this method, start with a small table and experiment with the hourly and branding options. You will quickly see how a simple workflow can replace hours spent tinkering with charts.
Download the SimpleGantt Excel add-in here: SimpleGantt Download