The EASIEST way to load multiple EXCEL sheets in PANDAS

Introduction
Today, I’m diving into the simplest method to convert multiple Excel sheets into pandas dataframes. I’ll also share a neat trick for merging multiple dataframes into one. Let’s get started!
The quickest way
In my Excel workbook, I have six worksheets, each containing sales records for different countries. The data in most sheets starts from cell A1, except for India, where it starts from cell B1. To load every sheet into a pandas dataframe, I’ll first show you the quickest way.
After importing pandas and defining the file path to the workbook, I’m reading the spreadsheet using pd.read_excel. Here’s the trick: set sheet_name to None. This tells pandas to create a dataframe for each sheet, and when executed, it returns a dictionary where the keys are the sheet names.
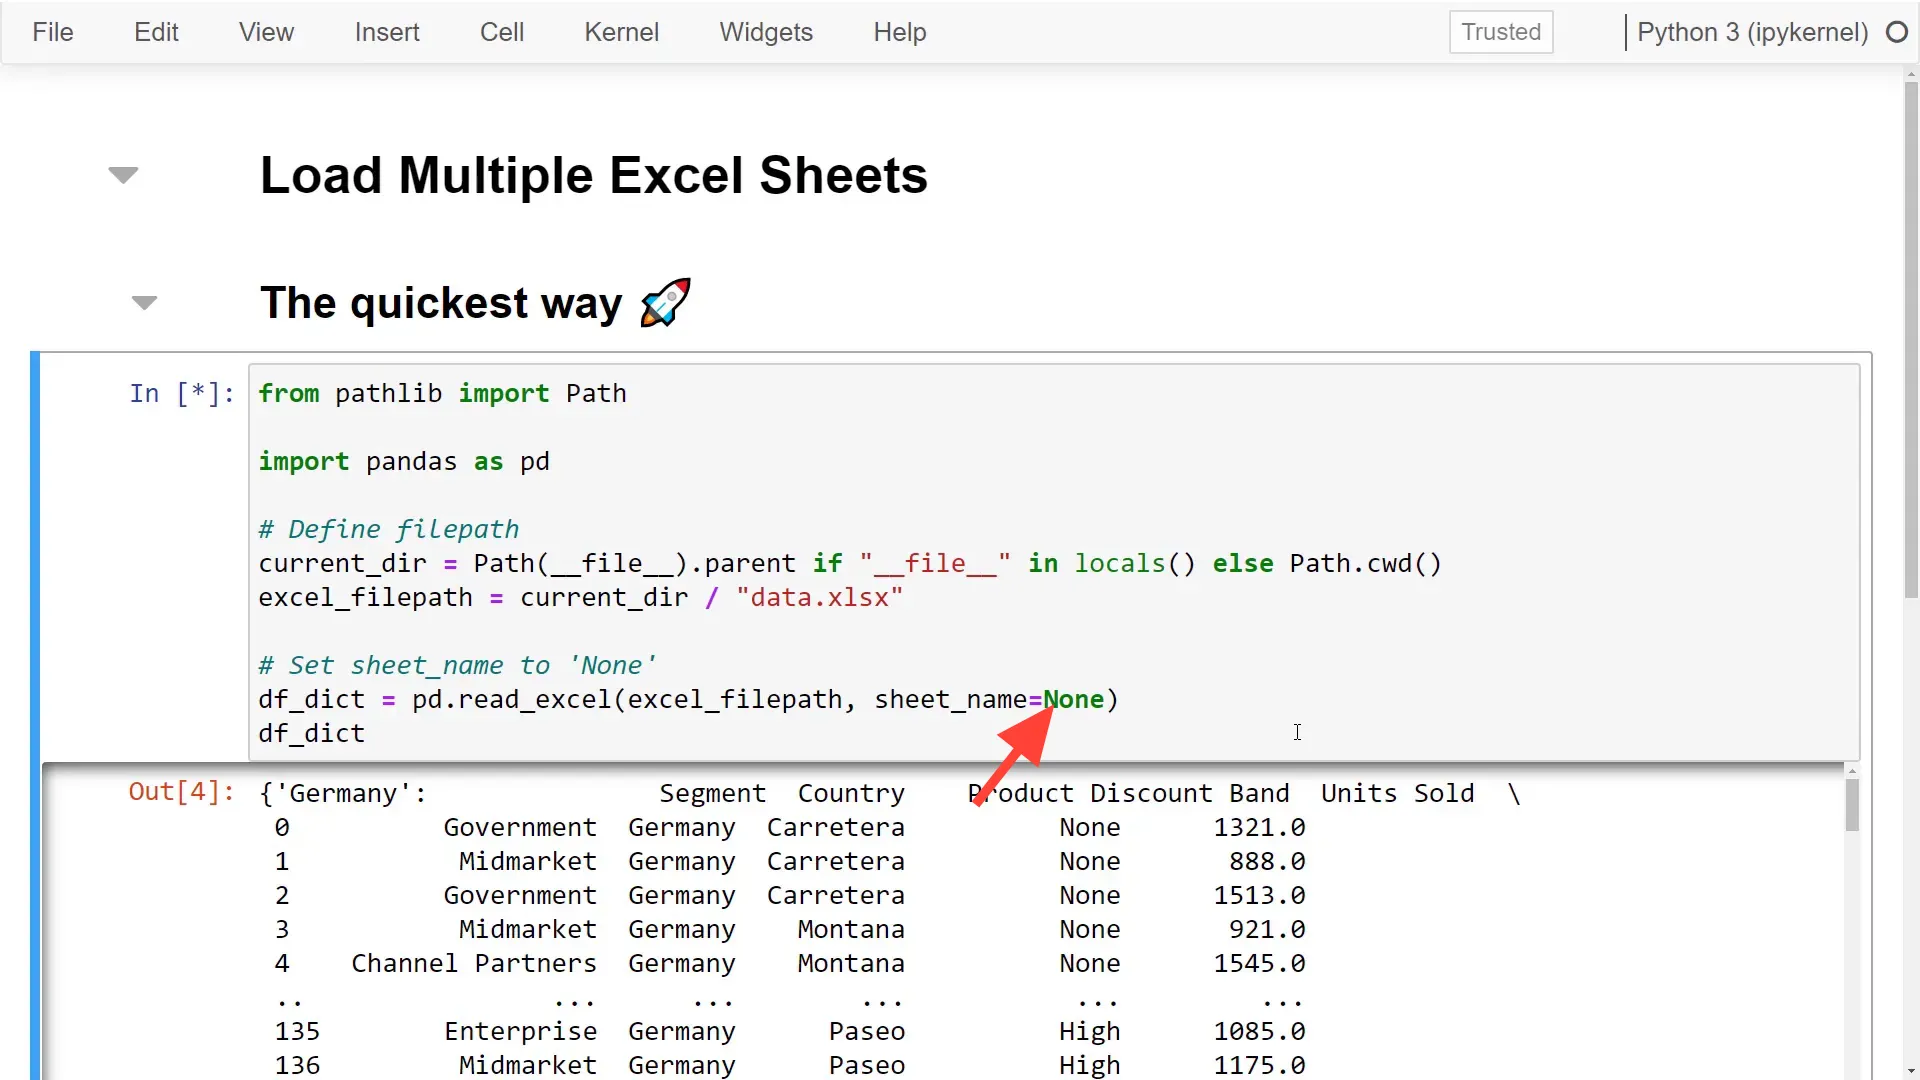
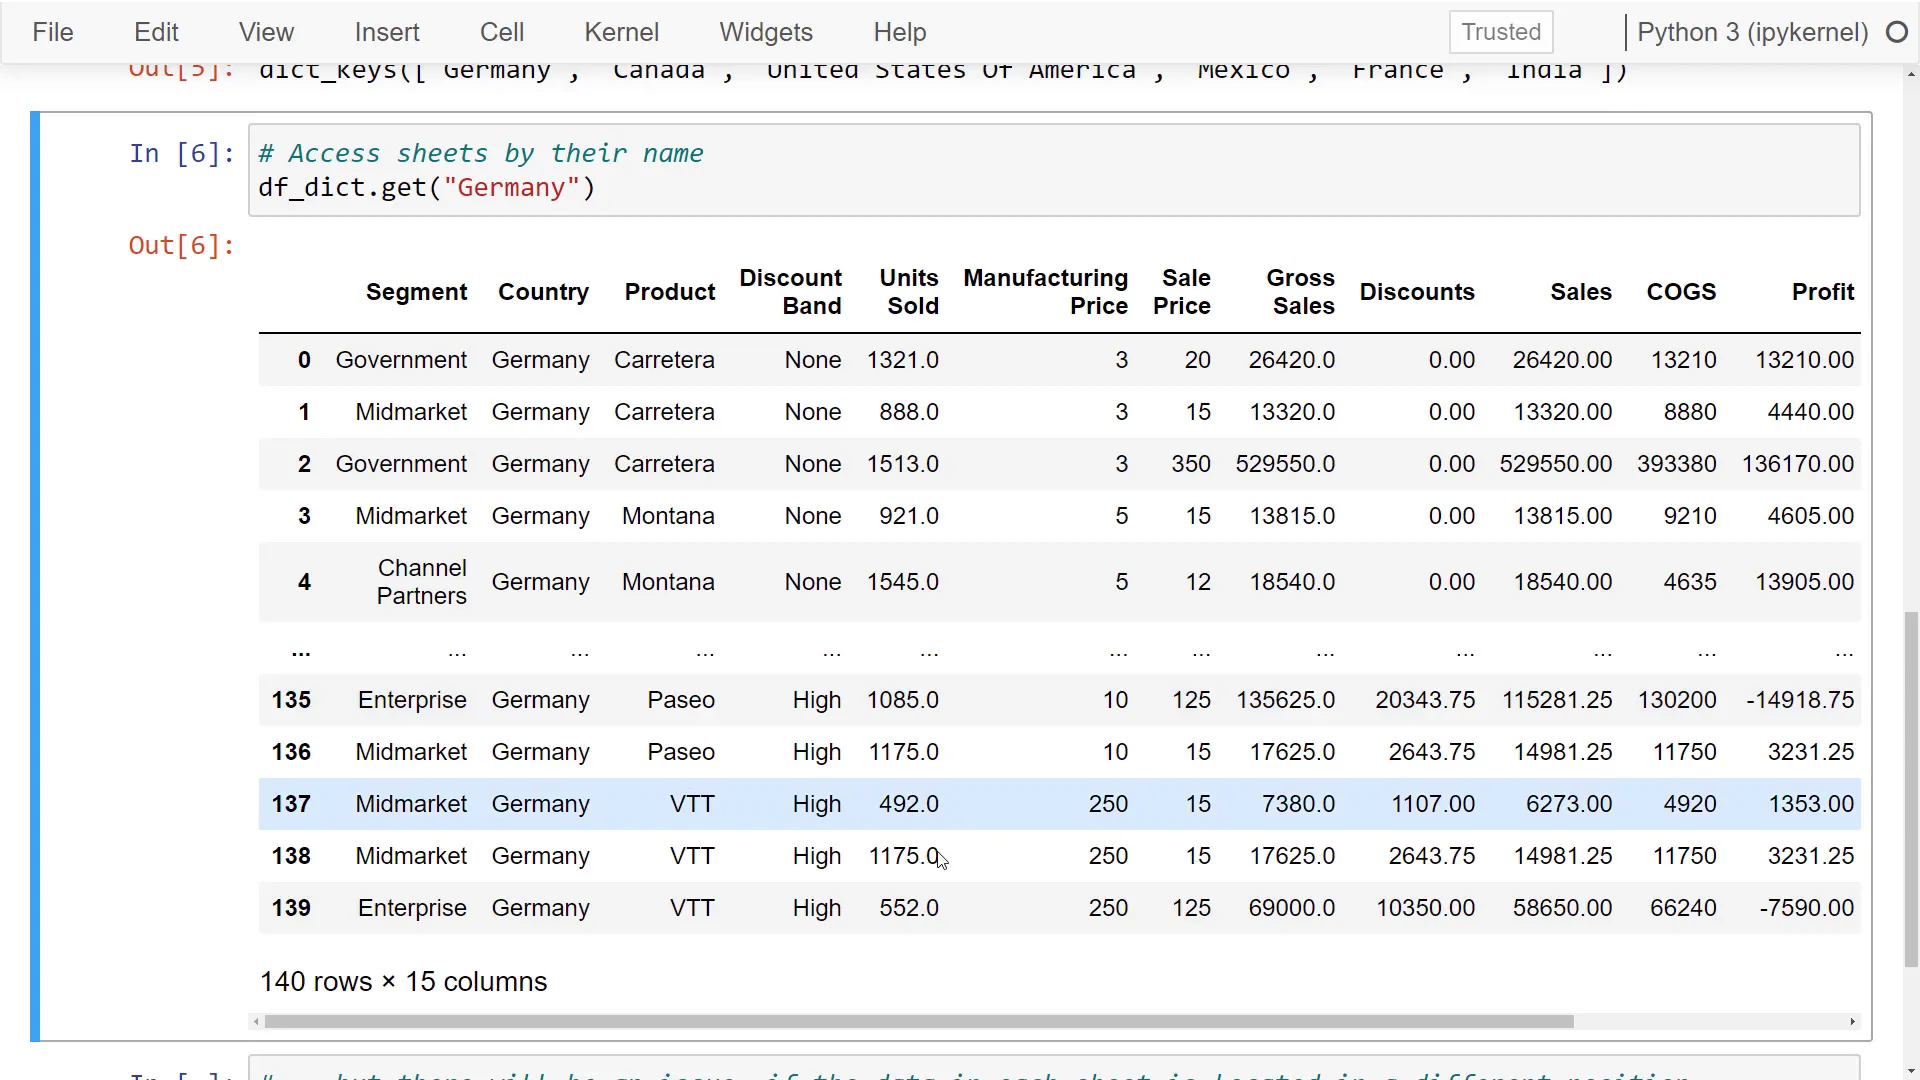
For example, the first sheet is Germany, followed by Canada, and so on. You can check the keys to see all the sheet names. If you want to process the data further, you can use get with the sheet name to retrieve the respective dataframe.
However, there’s a catch. By default, pandas reads data starting from cell A1. Since India’s data starts from B1, you’ll end up with an empty column and missing headers. While you could clean the dataframe afterward, it’s better to read the data correctly from the start.
The flexible way
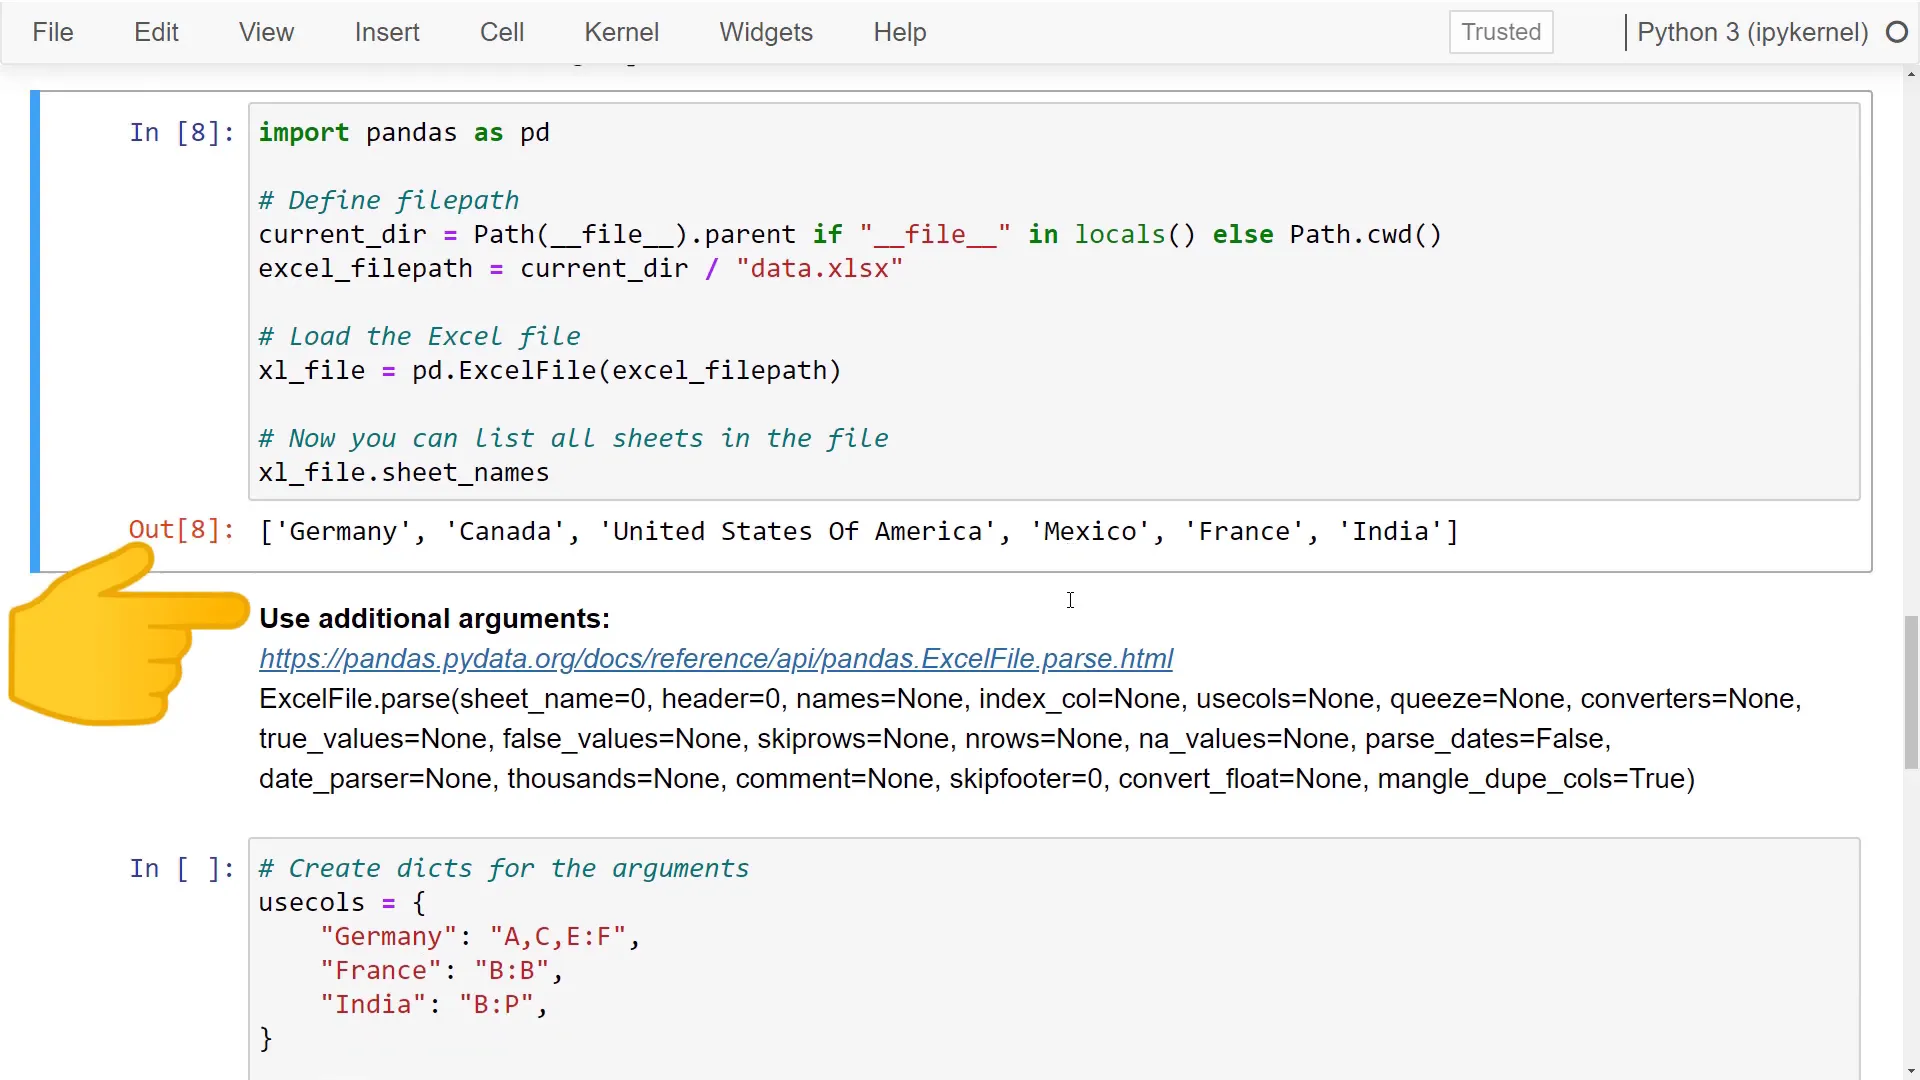
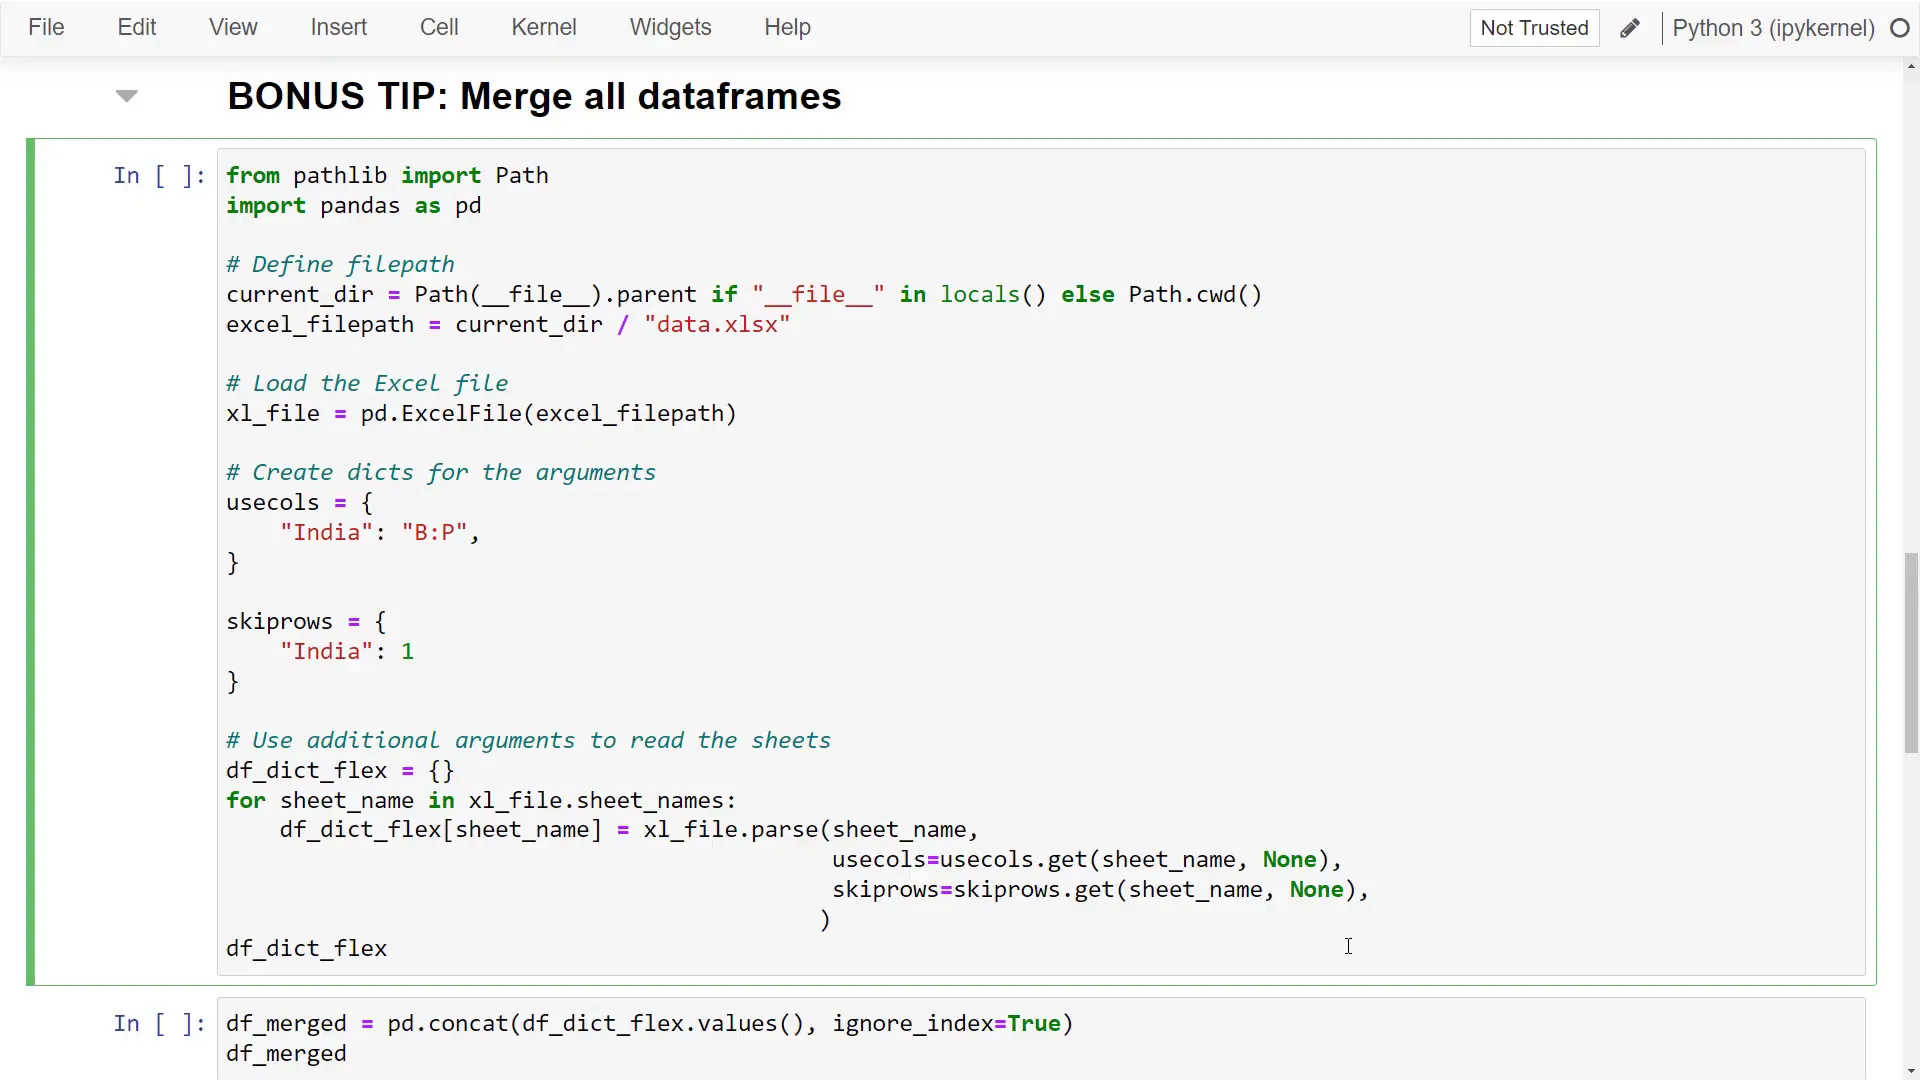
To tackle this, I’ve devised a “flexible way.” Similar to before, I define the file path, but this time I use pd.ExcelFile to load the entire spreadsheet. Now, I can access the file and print out all sheet names.
With the sheet names known, I can iterate over each sheet and create a dictionary similar to the previous one. I start by creating an empty dictionary, then iterate over each sheet, defining the sheet name as the key and the dataframe as the value by using parse on the Excel file.
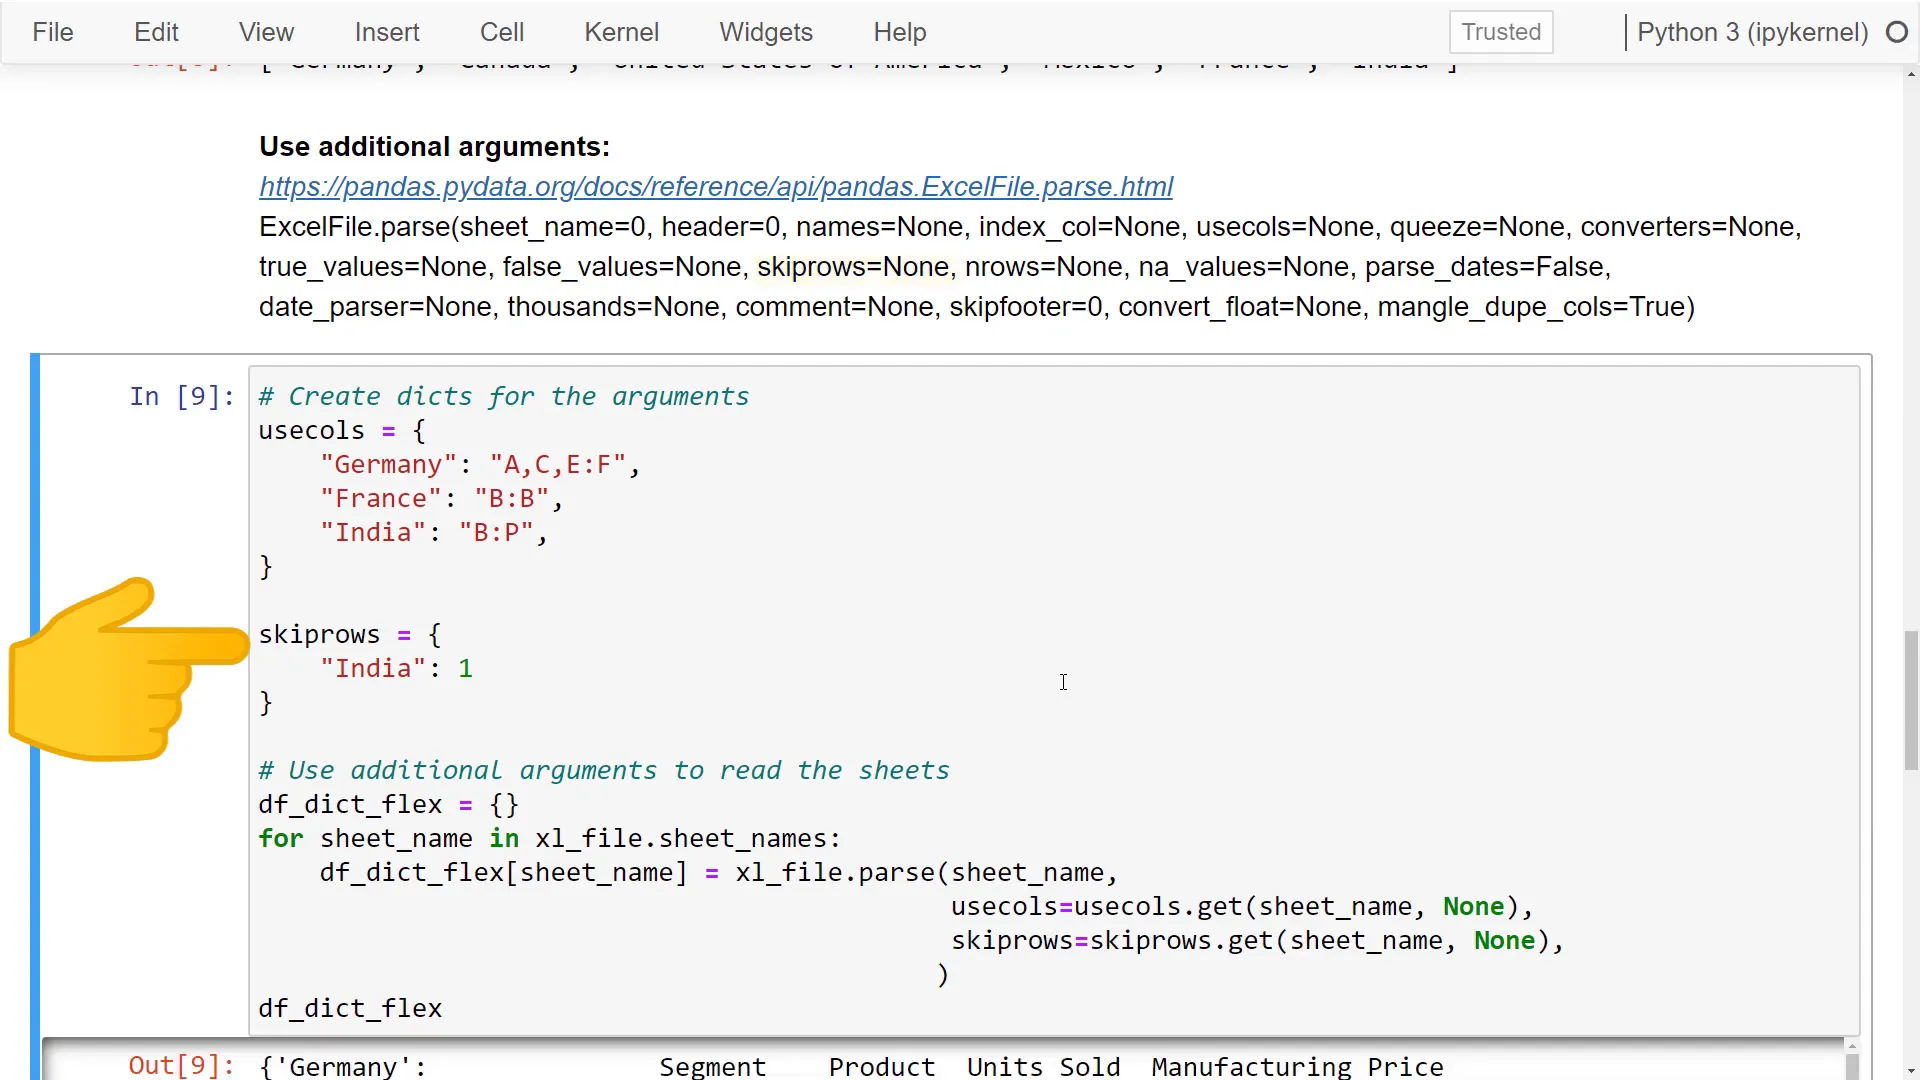
The great part is I can use additional arguments. For example, I can specify which columns to parse with usecols. At the beginning, I define a dictionary to set which columns I want to use for each sheet. If Python can’t find the sheet name in this dictionary, a default value can be set—in my case, none.
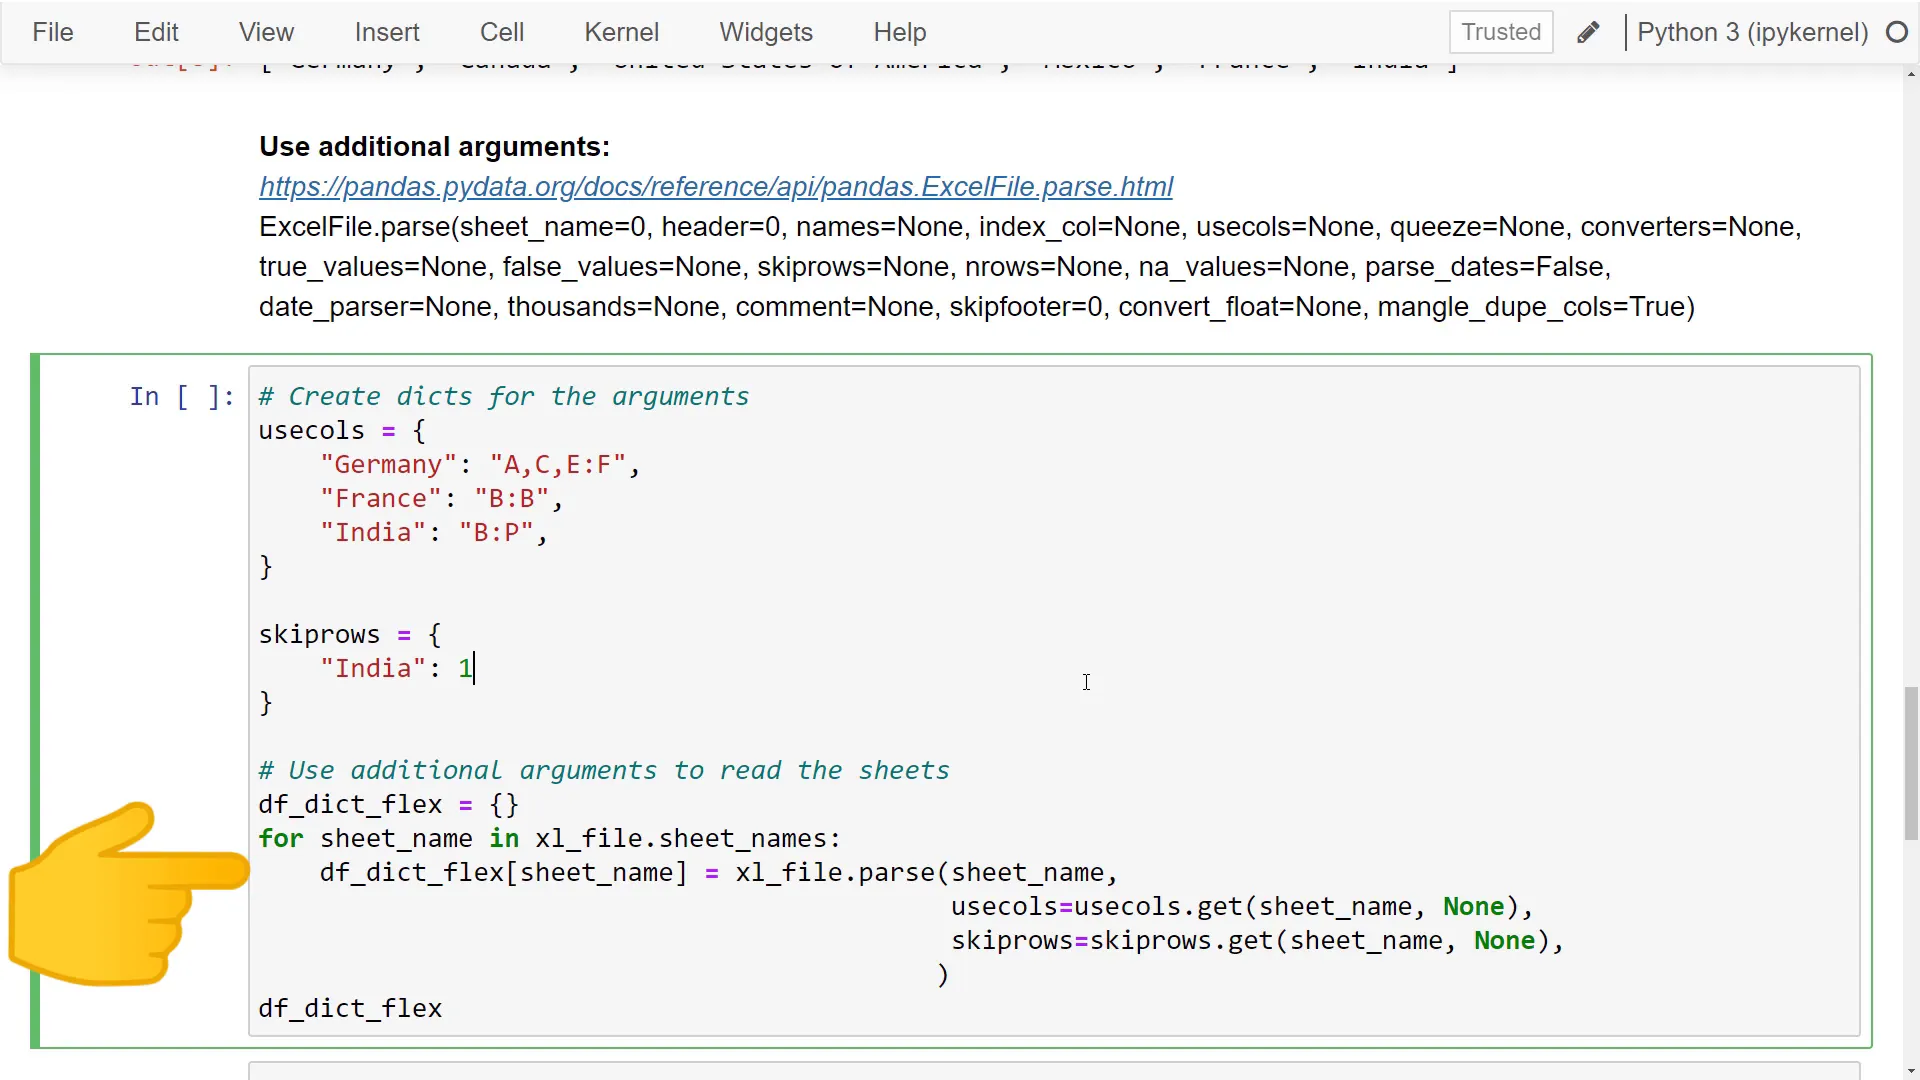
Moreover, I can specify how many header rows pandas should skip for the India sheet. After executing this, pandas returns a dictionary that mirrors the previous structure. However, when I retrieve the dataframe for Germany, it contains only the specified columns, while the dataframe for India is much cleaner, excluding the first empty row.
Bonus
Before wrapping up, here’s a bonus tip: I’ll show you how to merge all Excel sheets into a single dataframe. Using the flexible option, I only need to clean the dataframe for India. Once cleaned, pandas returns a dictionary containing separate dataframes for each sheet.
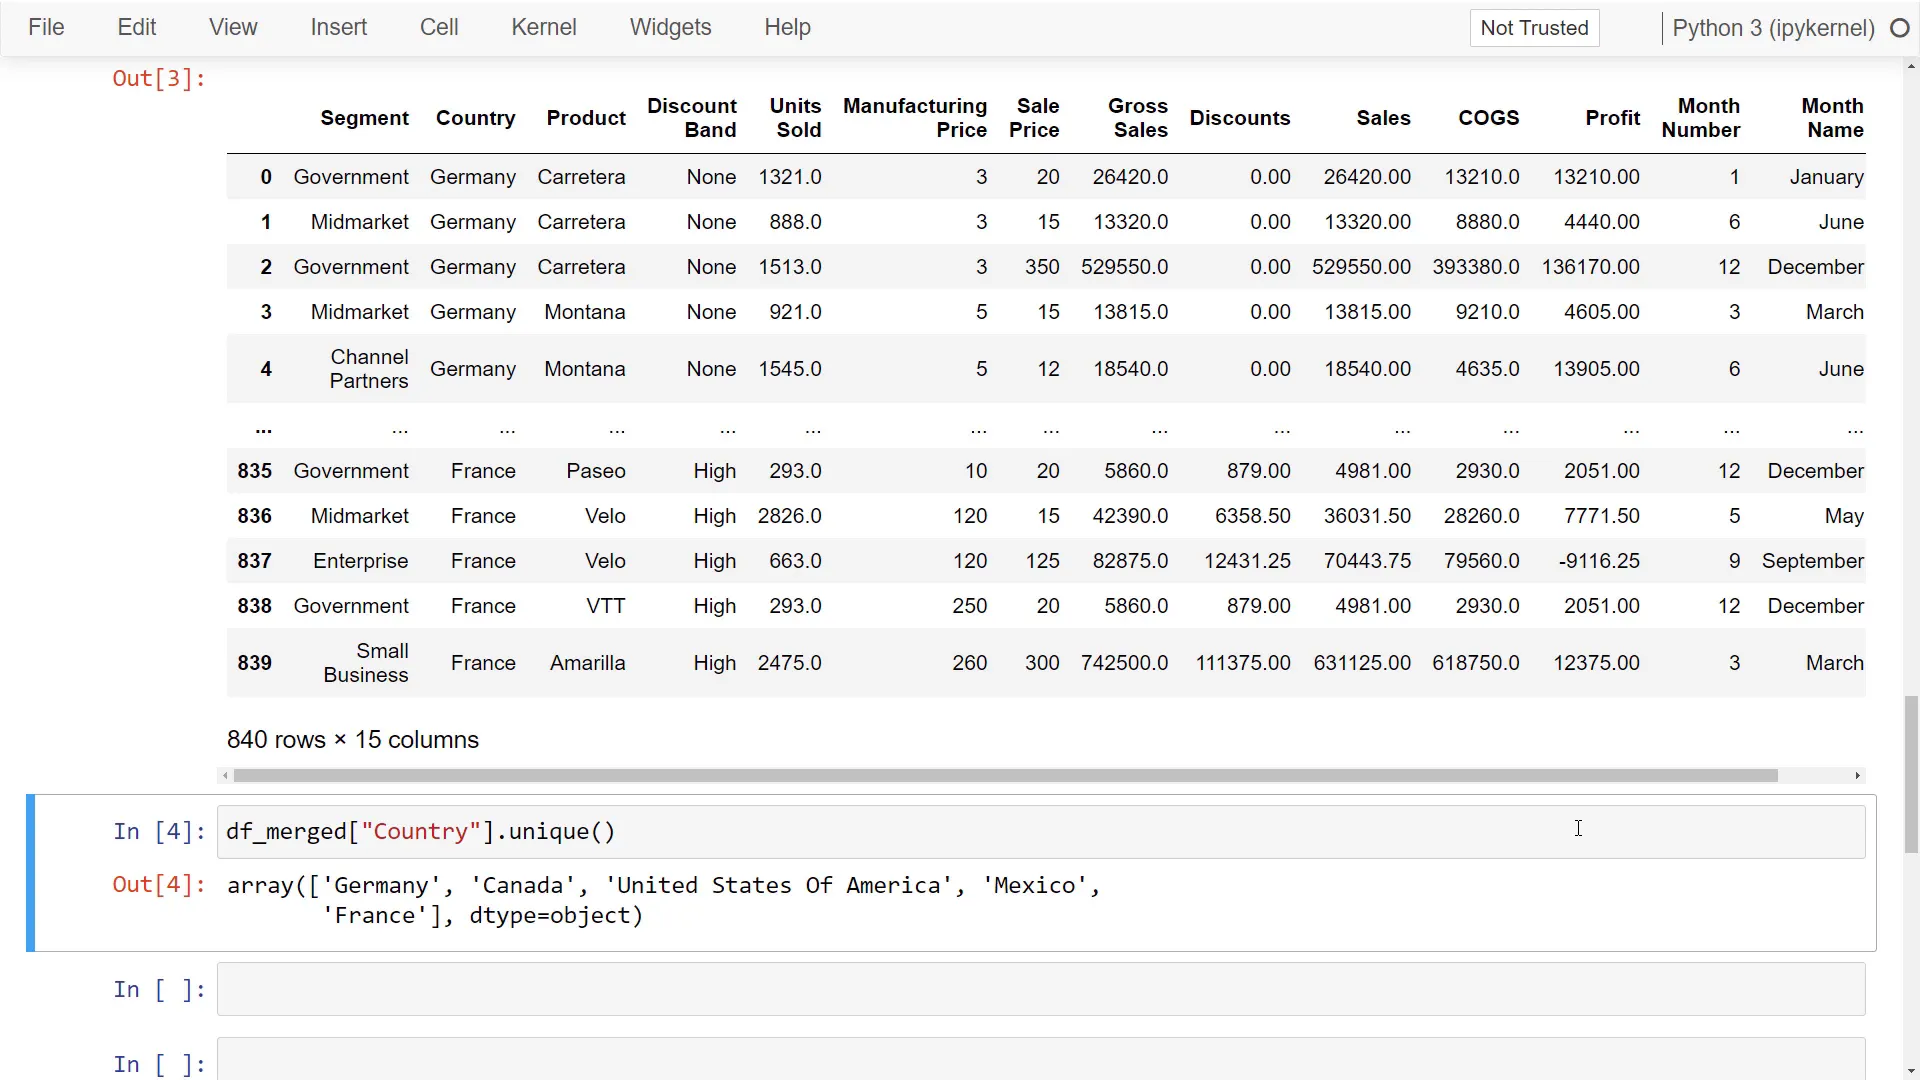
To combine all dataframes into one, I’ll use pd.concat and pass in the values from our dictionary. Running this cell gives back a single dataframe that includes data from all countries. You can easily validate this by printing all unique values from the Country column, confirming that it contains data from every country.
Outro
And that’s all I have for you today! Thanks for tuning in!