4 Pandas Functions That I Wish I Knew Earlier

Introduction
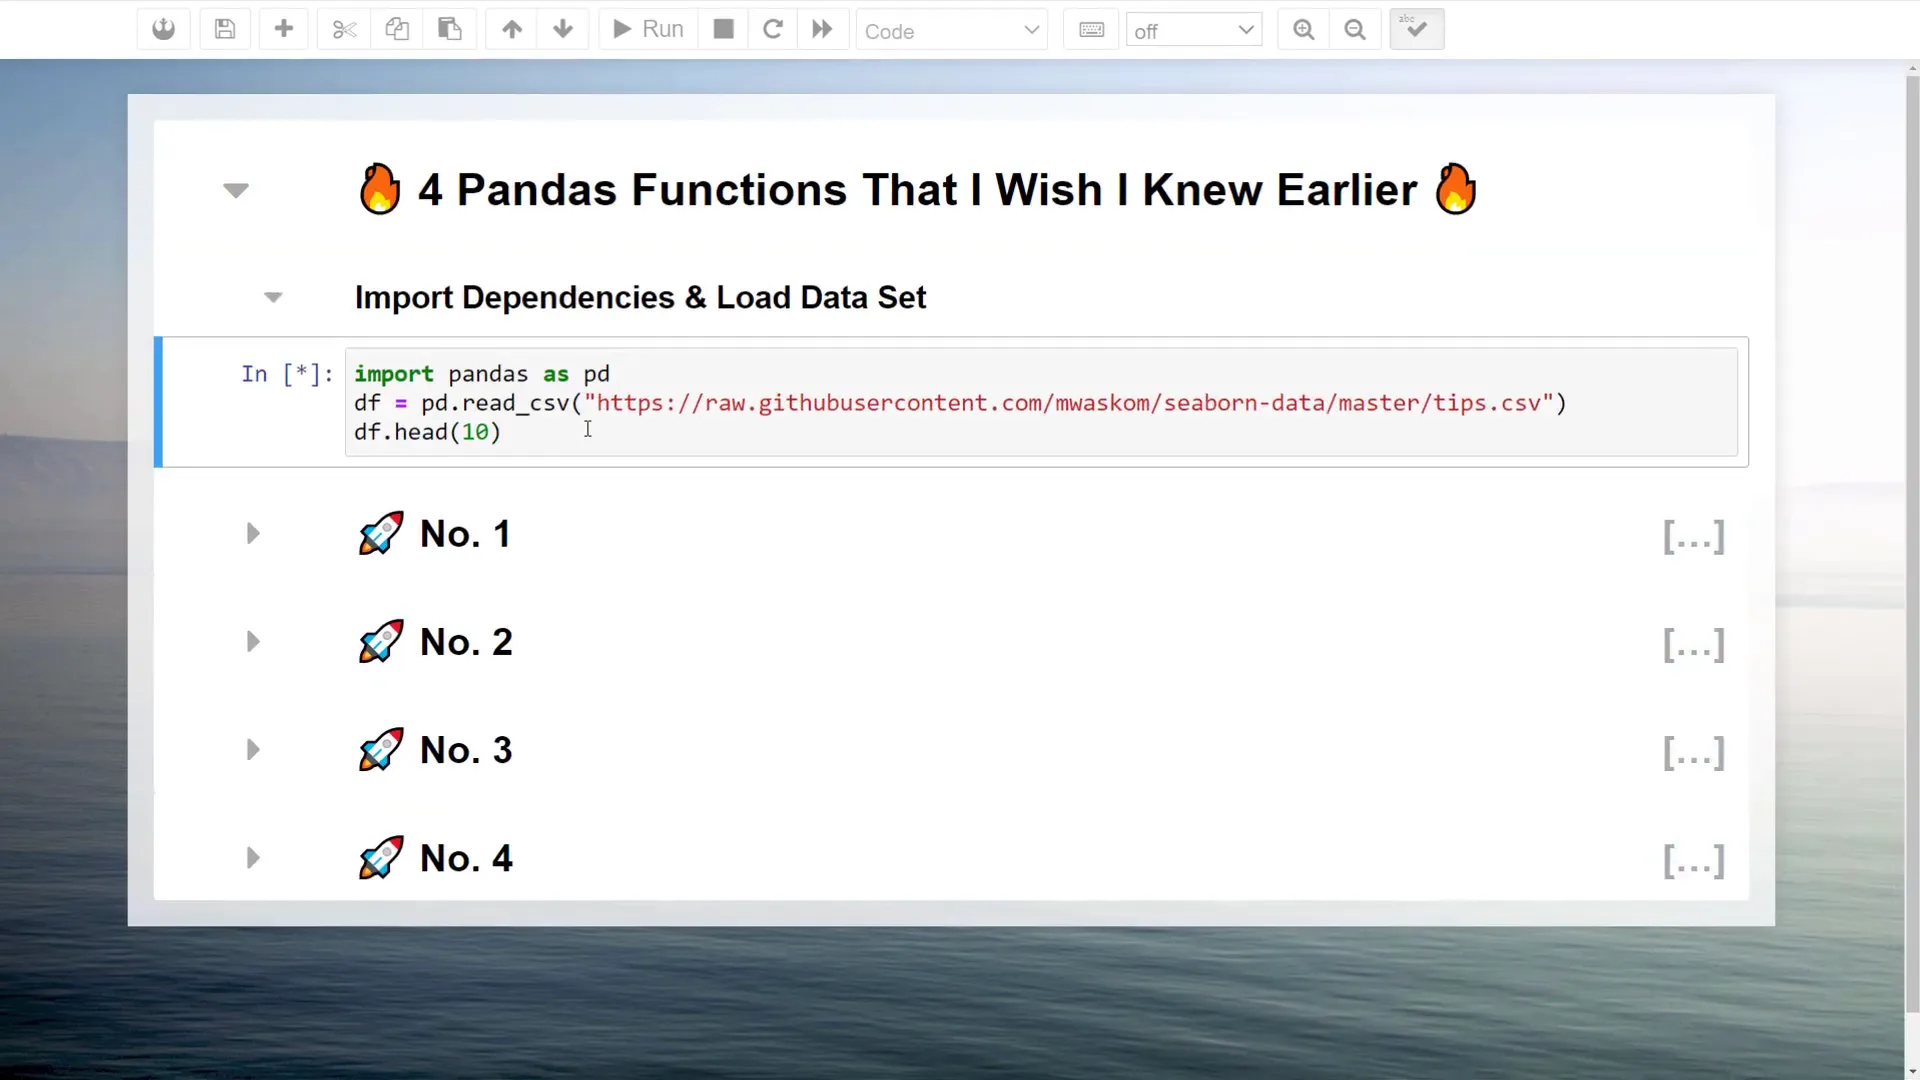
In this post, I’ll share four Pandas functions that I wish I knew earlier. I’ll be using the “tips” dataset from the seaborn library. This dataset contains information about the total bill, tip size, customer details, and the timing of their visit. Let’s kick things off with one of my favorite Pandas functions.
Query Function
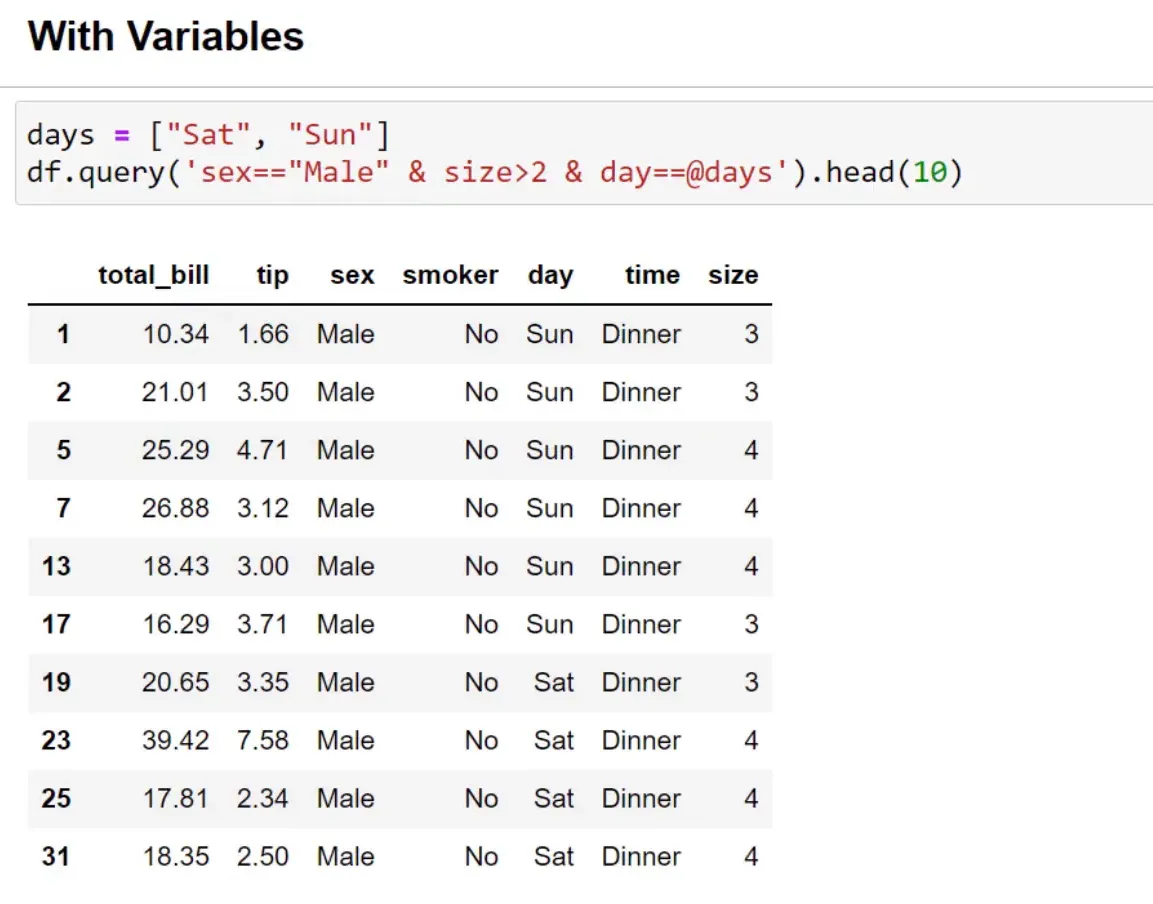
Whenever I deal with data, filtering the dataset is often necessary. A straightforward way to do this is by using the Pandas query function. For example, if I want to filter for male customers whose party size is greater than two, I can easily do that with the query function.
Previously, I used boolean masks, which could get messy, especially with multiple criteria. The query function allows for cleaner syntax and even lets you include variables. If I want to filter for data on Saturday and Sunday, I can create a list of my filter criteria, and by using the ‘@’ symbol, I can pass this variable into the query function. So, next time you filter your dataset, consider trying this Pandas function!
N Largest
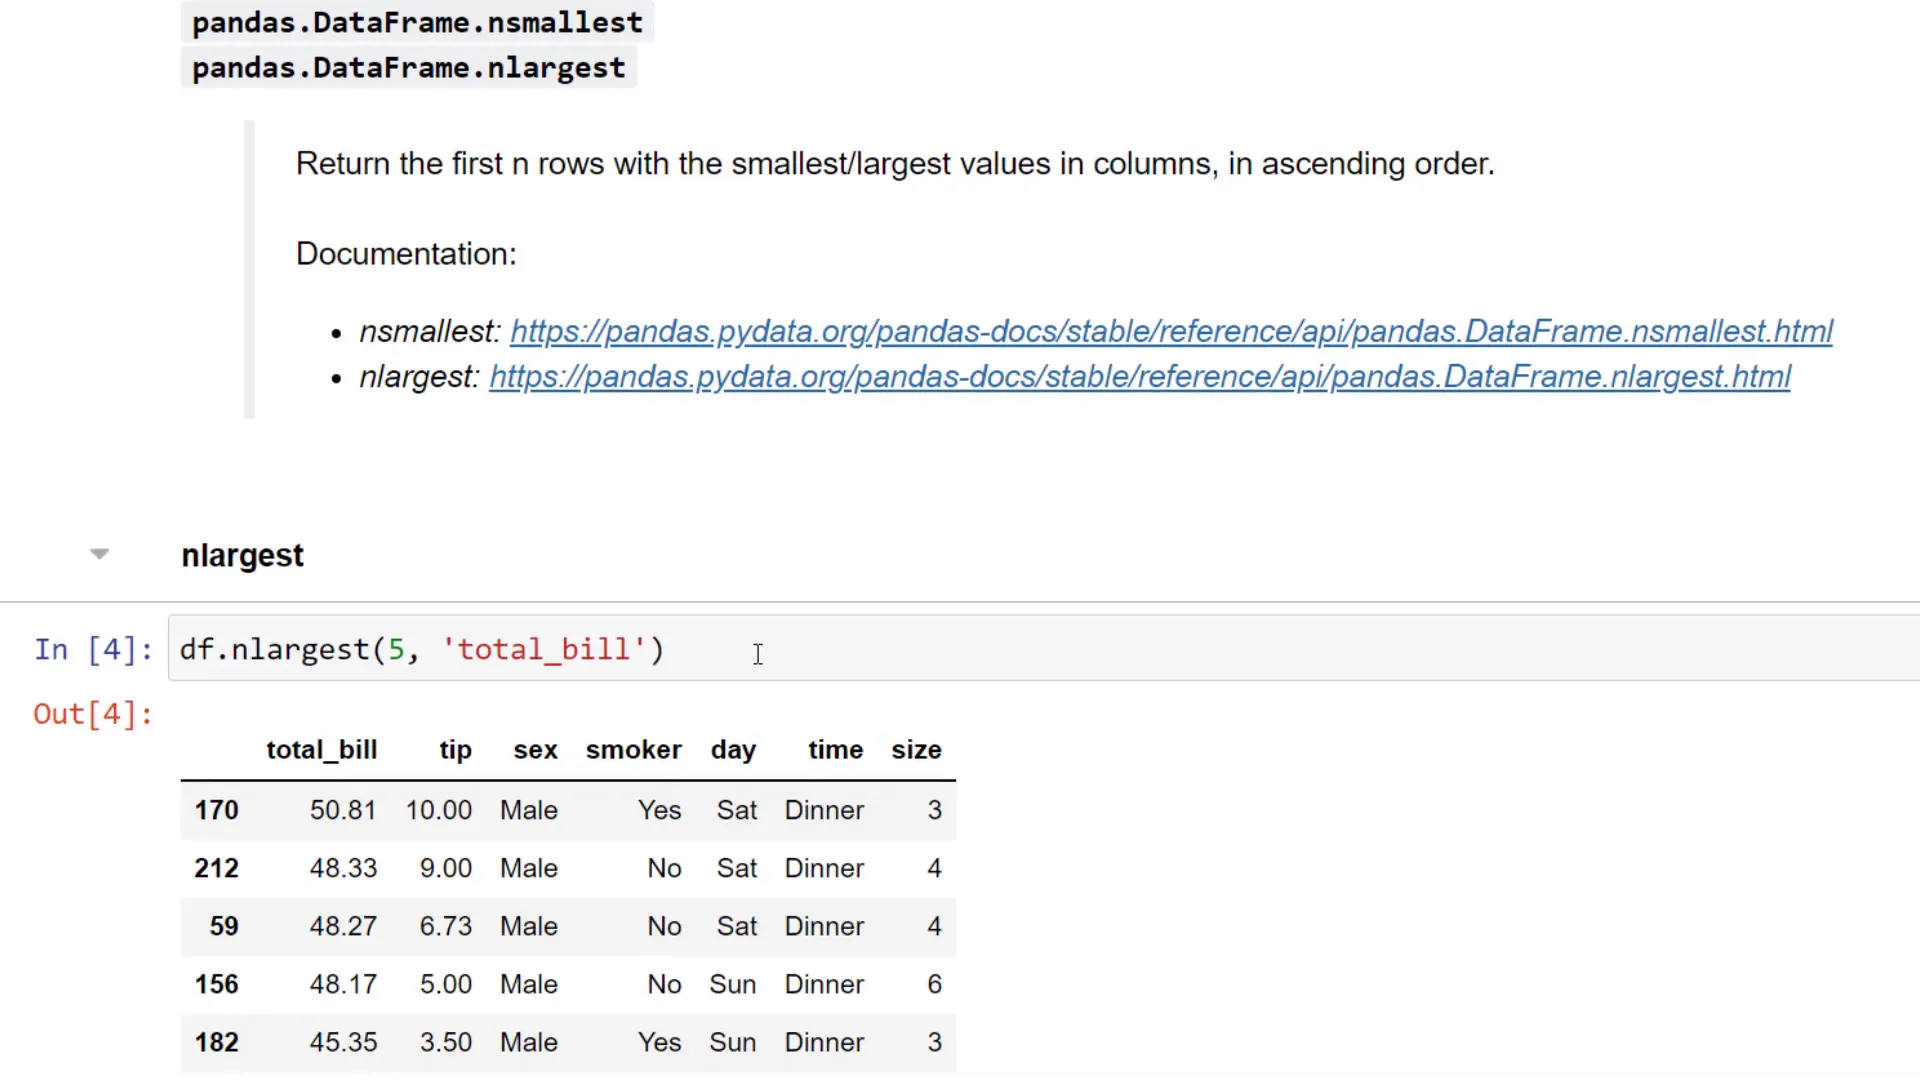
Next up is the ‘nlargest’ function. If I want to return the five largest total bill amounts, I can use this function directly. Before learning about it, I used to sort the values in descending order and then returned the top entries. The ‘nlargest’ function simplifies this process immensely. Similarly, I can use ‘nsmallest’ to retrieve the smallest values.
Group By
Now, let’s talk about the GroupBy function. You might already know this function, but it took me some time to realize that I could pass additional parameters to it. For a simple example, I can group the dataset by gender and return the mean for all numerical values. This is quite similar to creating a pivot table in Excel.
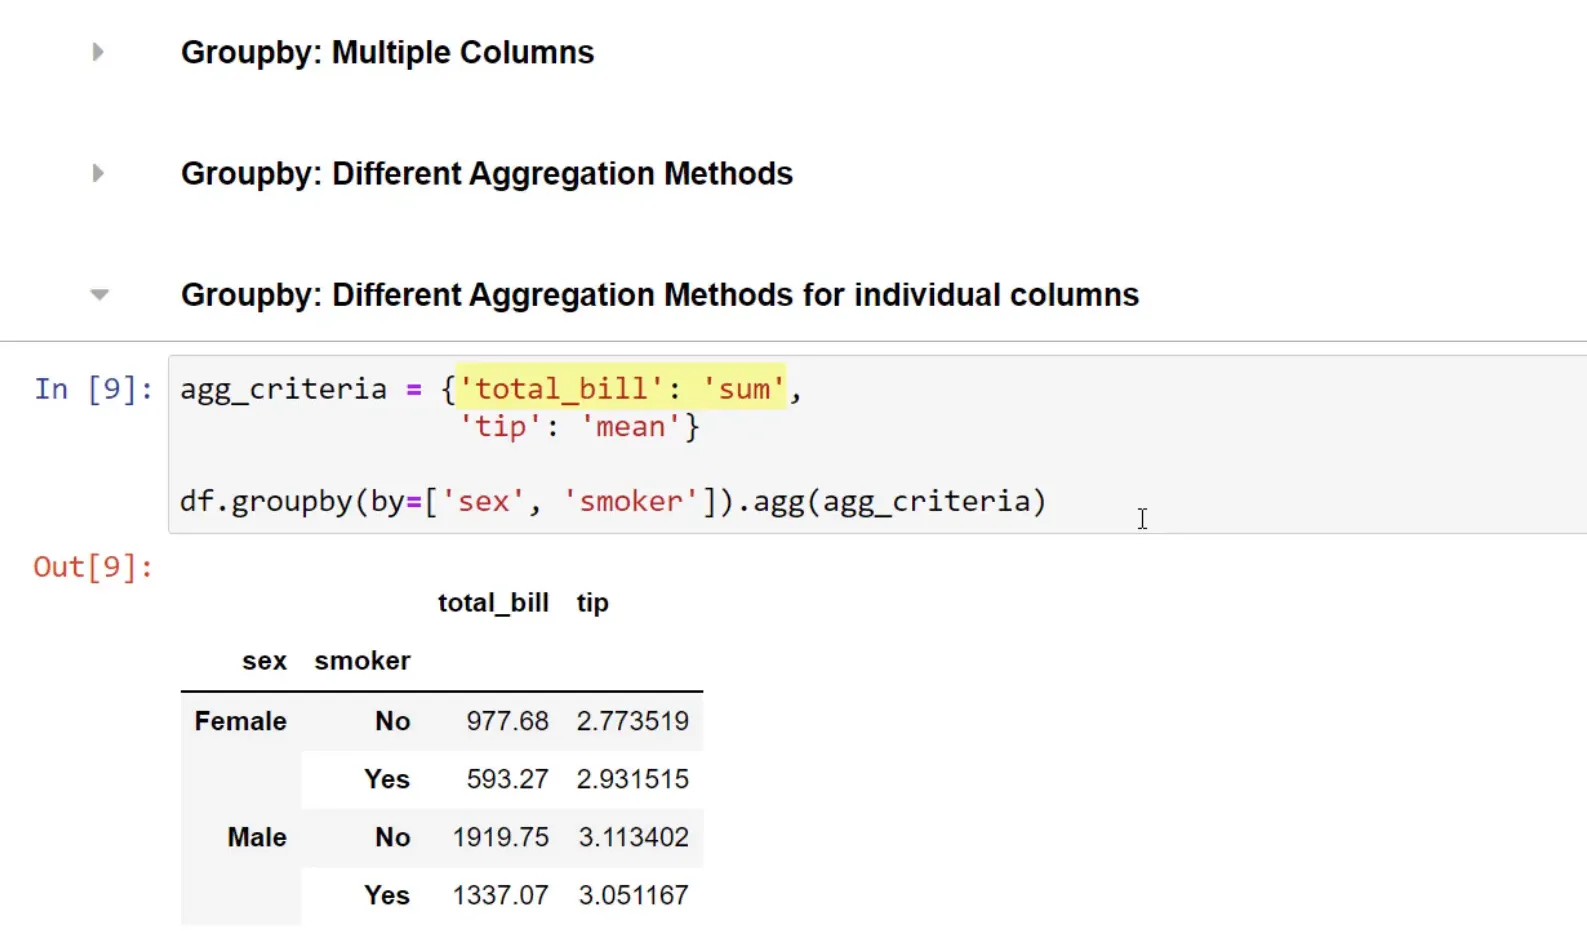
Moreover, I can group by multiple columns. What makes the GroupBy function powerful is that I can combine it with aggregation functions. For instance, if I want to return both the mean and sum for all numerical values, I can write it accordingly. Additionally, I can specify different aggregation methods for various columns by using a dictionary.
After passing this dictionary inside the aggregation function, Pandas will return a DataFrame. If I prefer not to have multiple indexes, I can set ‘as_index’ to False to flatten the DataFrame.
Cut
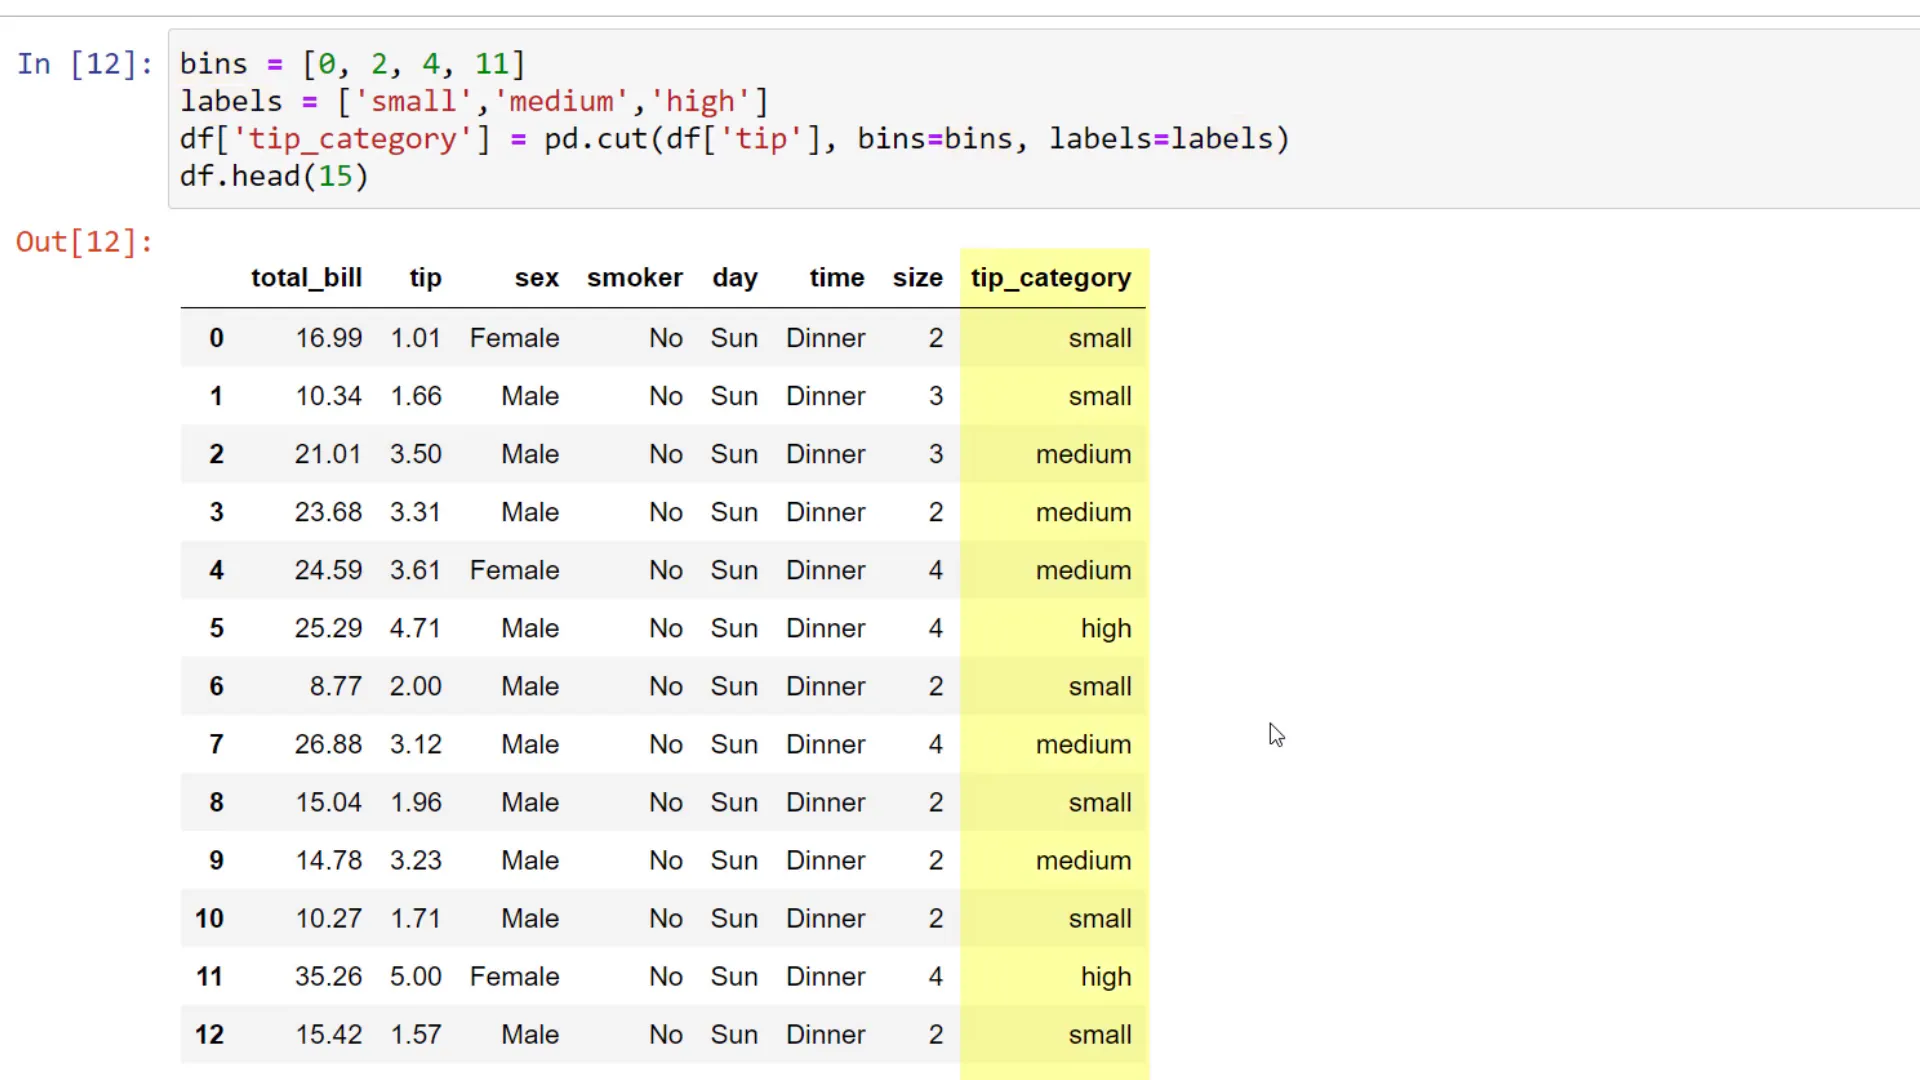
The last function I want to discuss is the Pandas ‘cut’ function. This function allows me to create different bins or categories for a specific column. For example, looking at the distribution of tips, I notice that most customers tip between $2 and $3.
I can categorize tips into bins: for tips from $0 to $2, I label them as ‘small’; from $2 to $4, ‘medium’; and tips higher than $4 up to $11 as ‘high’. After defining the bins and labels, I can easily pass those lists to the Pandas cut function, and it will create a new column with the categorized data.
In many cases, I don’t want to hardcode my upper limit; for instance, if a customer tips $20, that should still fall into the ‘high’ category. Instead of entering a high number, I can use float ‘infinity’ for the upper bound and float ‘-infinity’ for the lower bound. This approach is much more elegant.
Conclusion
And those are my four Pandas functions that I wish I knew earlier! Let me know which function was new for you, or even better, share your favorite Pandas trick in the comments. Thanks for reading!