Don't do THIS Pandas mistake!

Introduction
When using the Groupby method in Pandas, there is a significant mistake that many users make which can lead to unexpected results. Let me take you through an example to illustrate this issue.

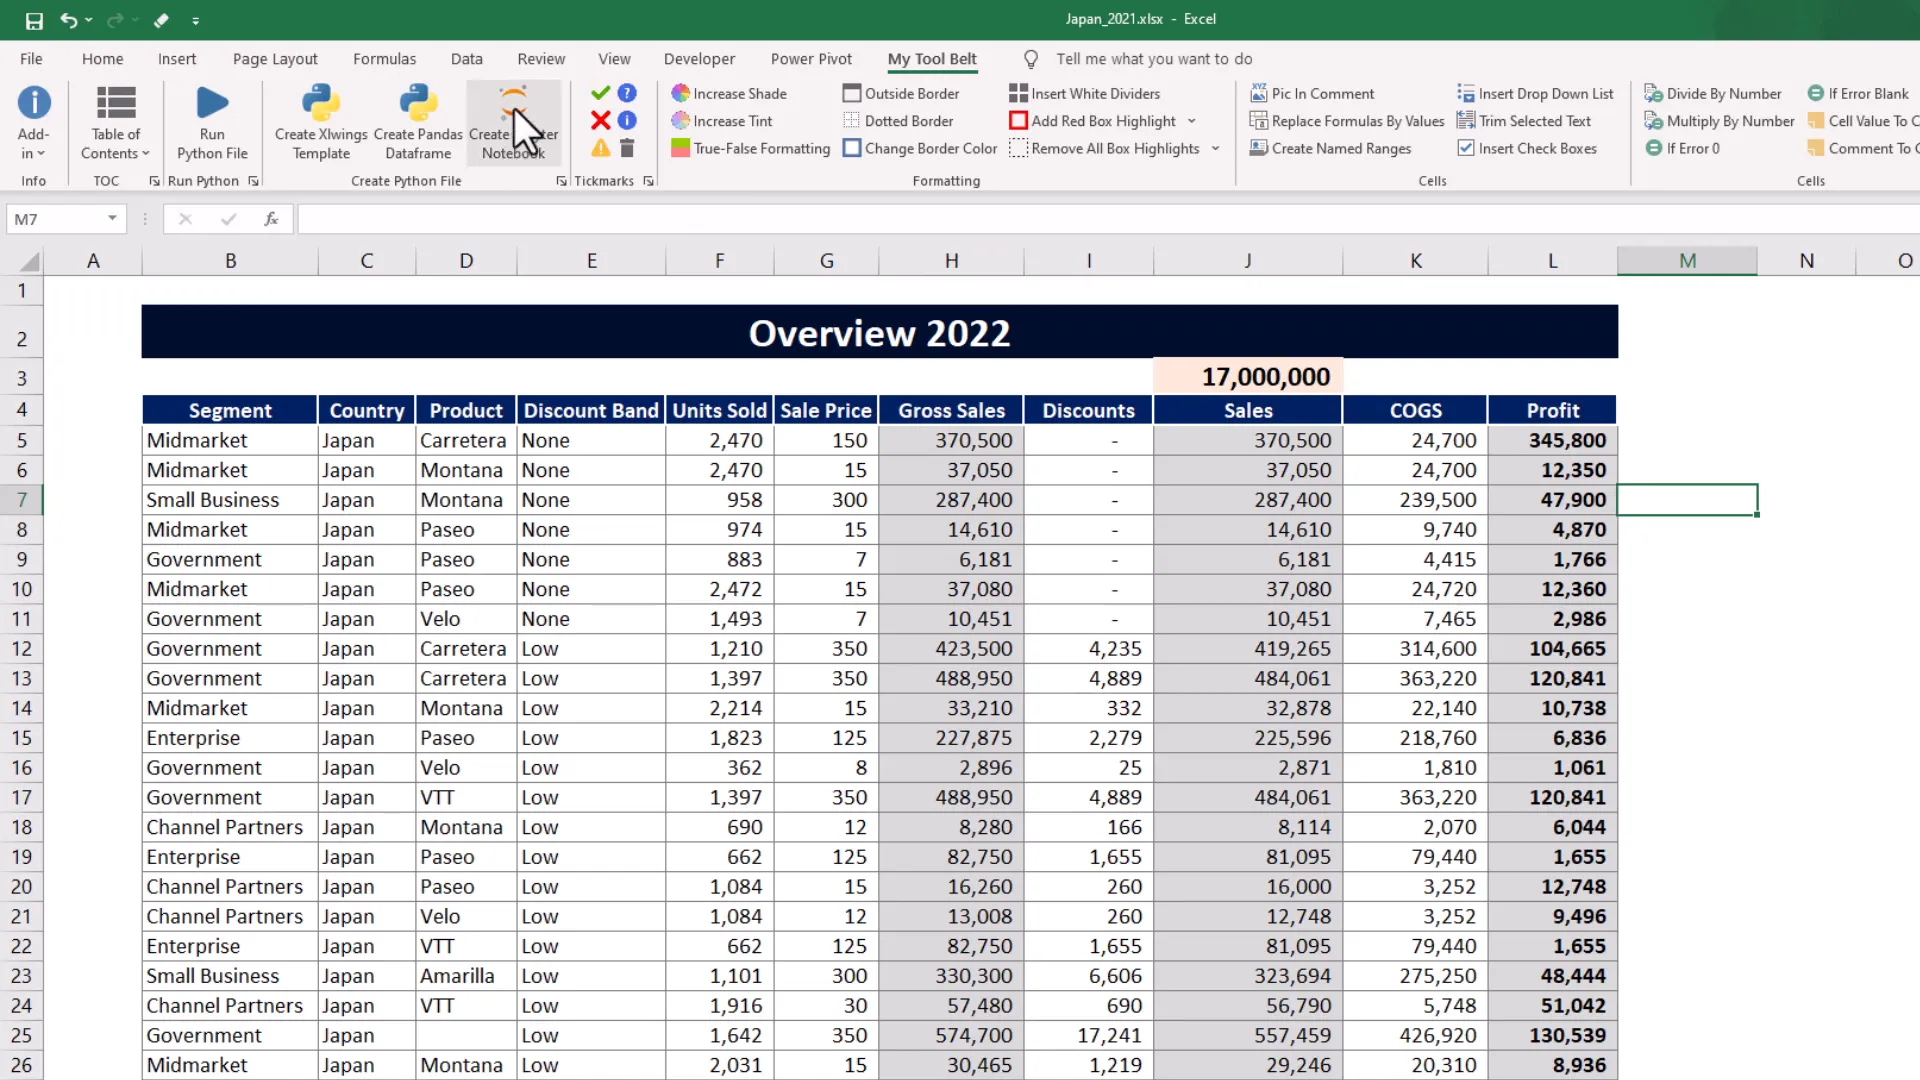
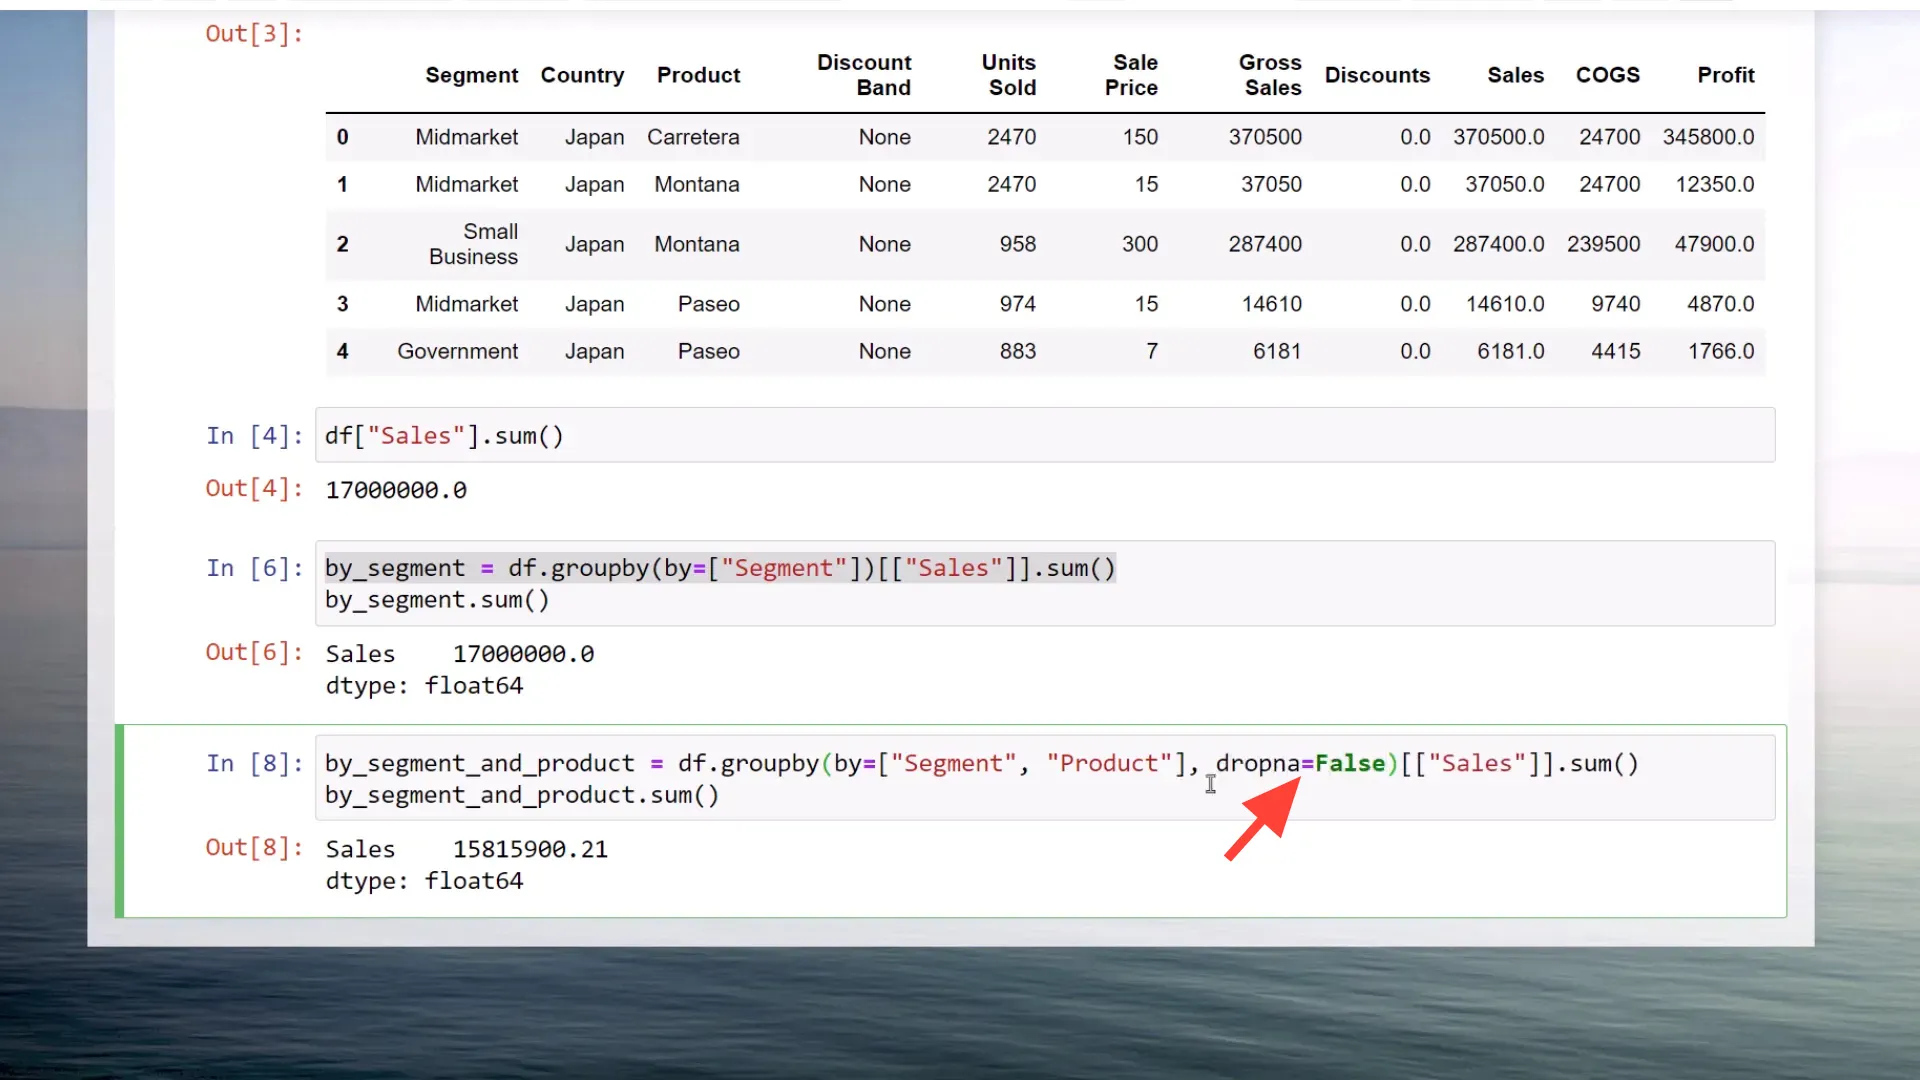
In my Excel file, I have some financial data for a business, with total sales amounting to 17 million USD. The first step is to convert this spreadsheet data into a Pandas DataFrame for analysis. I am using the MyToolBelt add-in for this. You can find the link to this add-in in the description box.
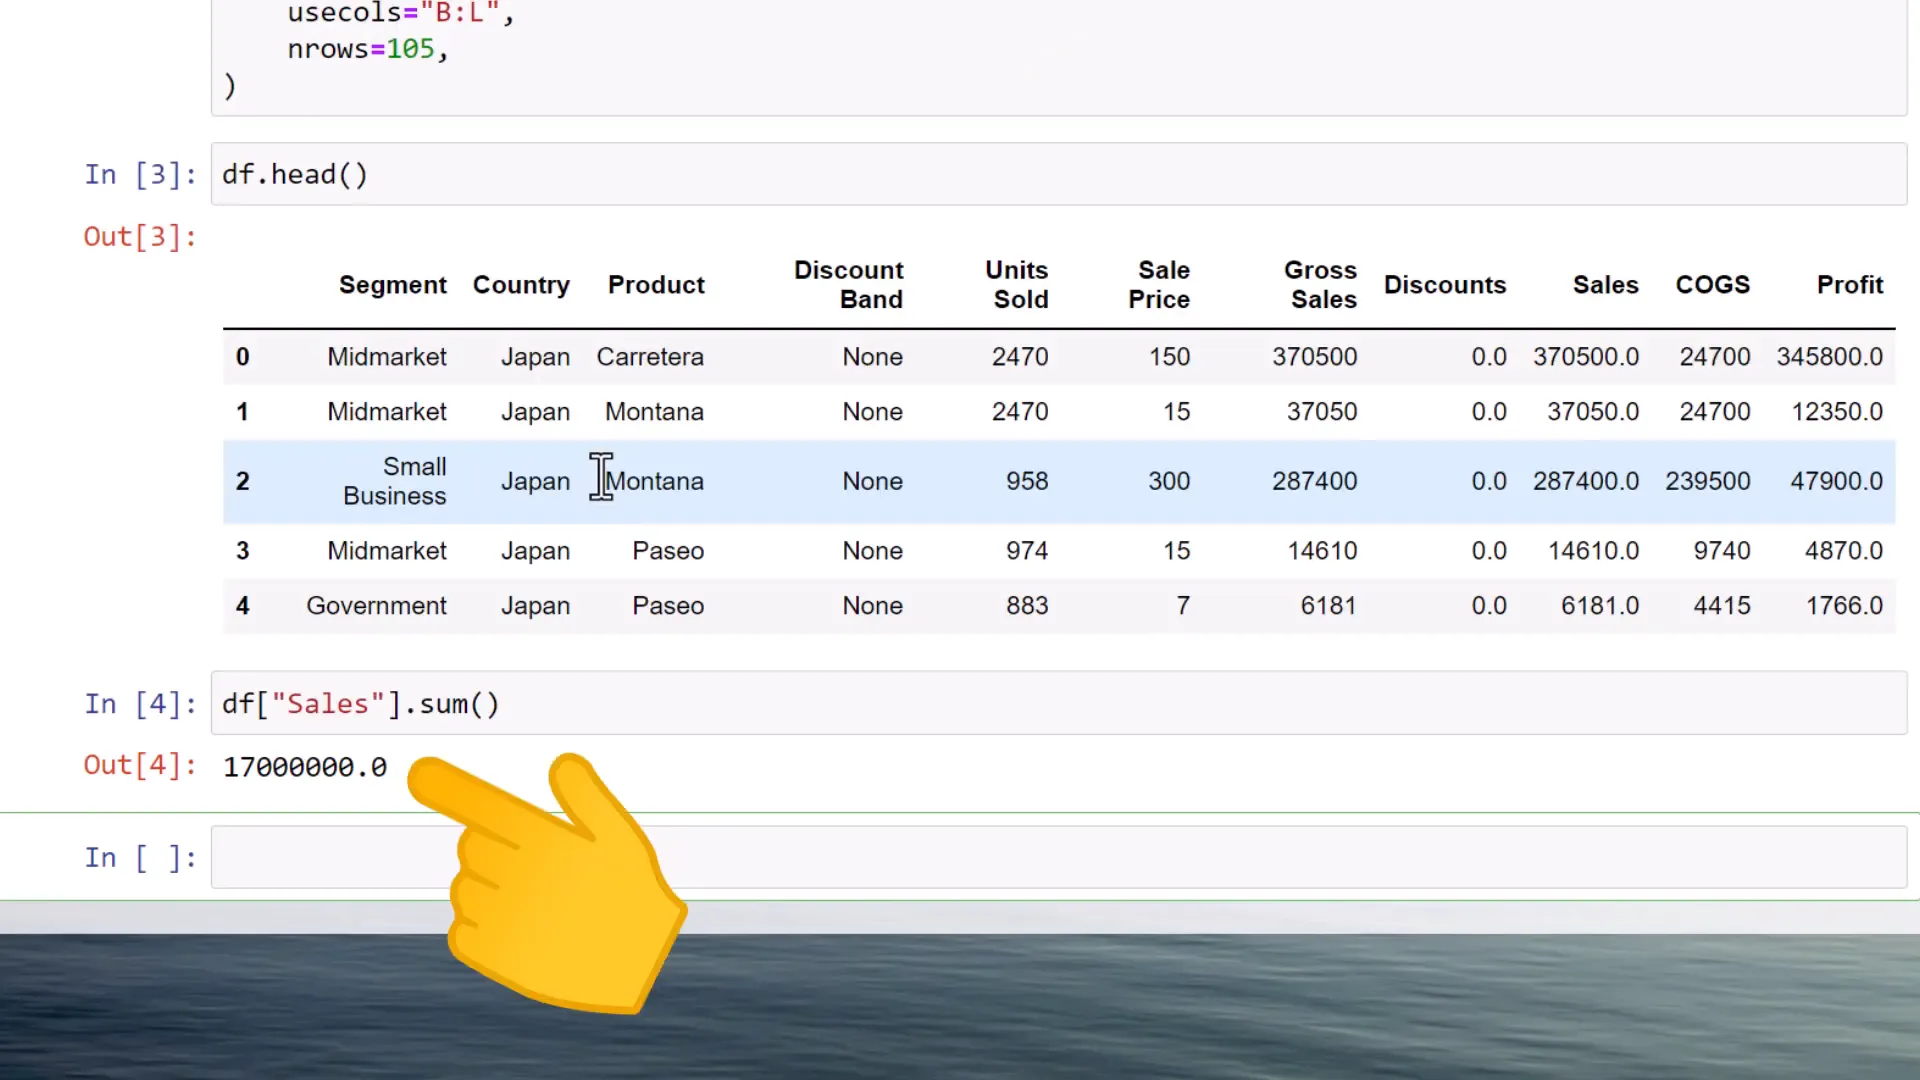
Once I select the data and insert a title, a new Jupyter notebook is created in the workbooks directory. After executing a couple of initial cells, I print out the DataFrame head. The DataFrame now reflects the same data as in the spreadsheet, and we can verify our total sales of 17 million USD when I sum up the sales.
Next, I group the sales by segment. After executing this cell, the DataFrame looks good, and I validate everything by summing up the sales again—still 17 million.
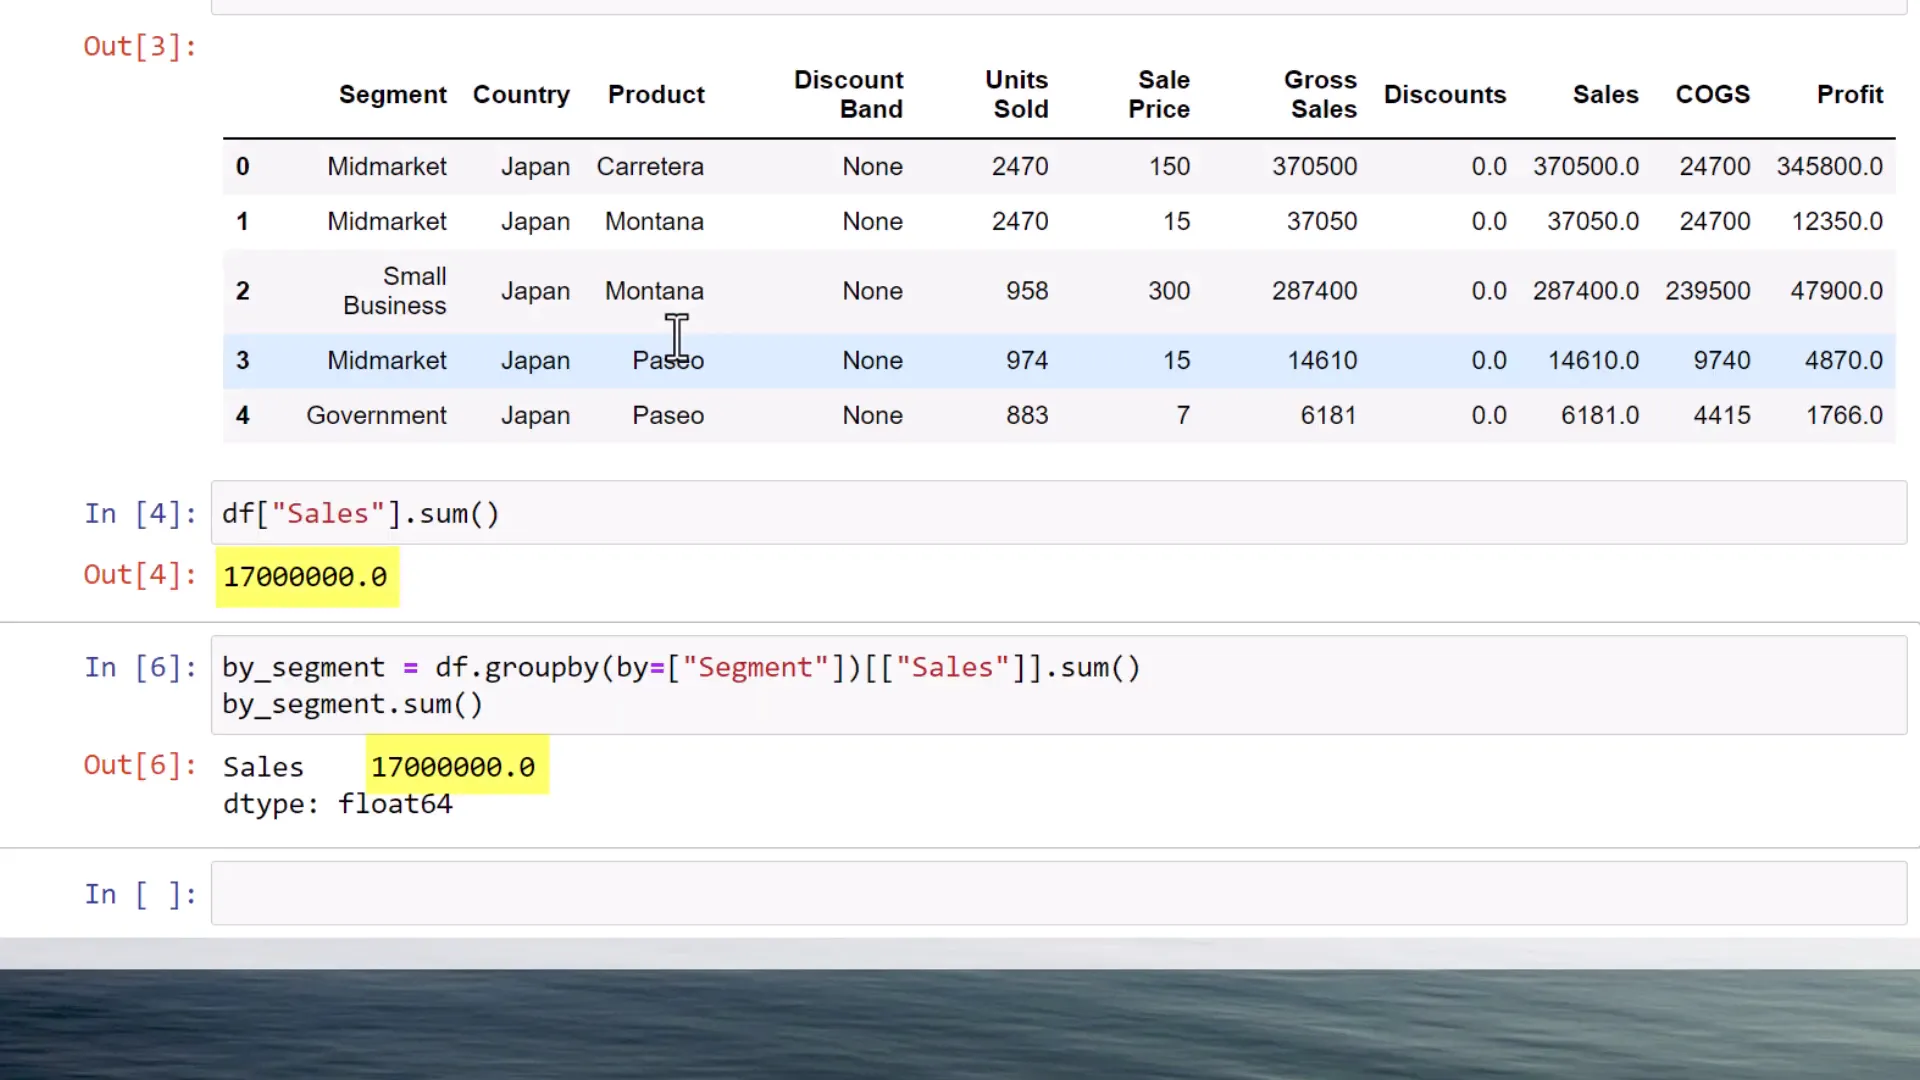
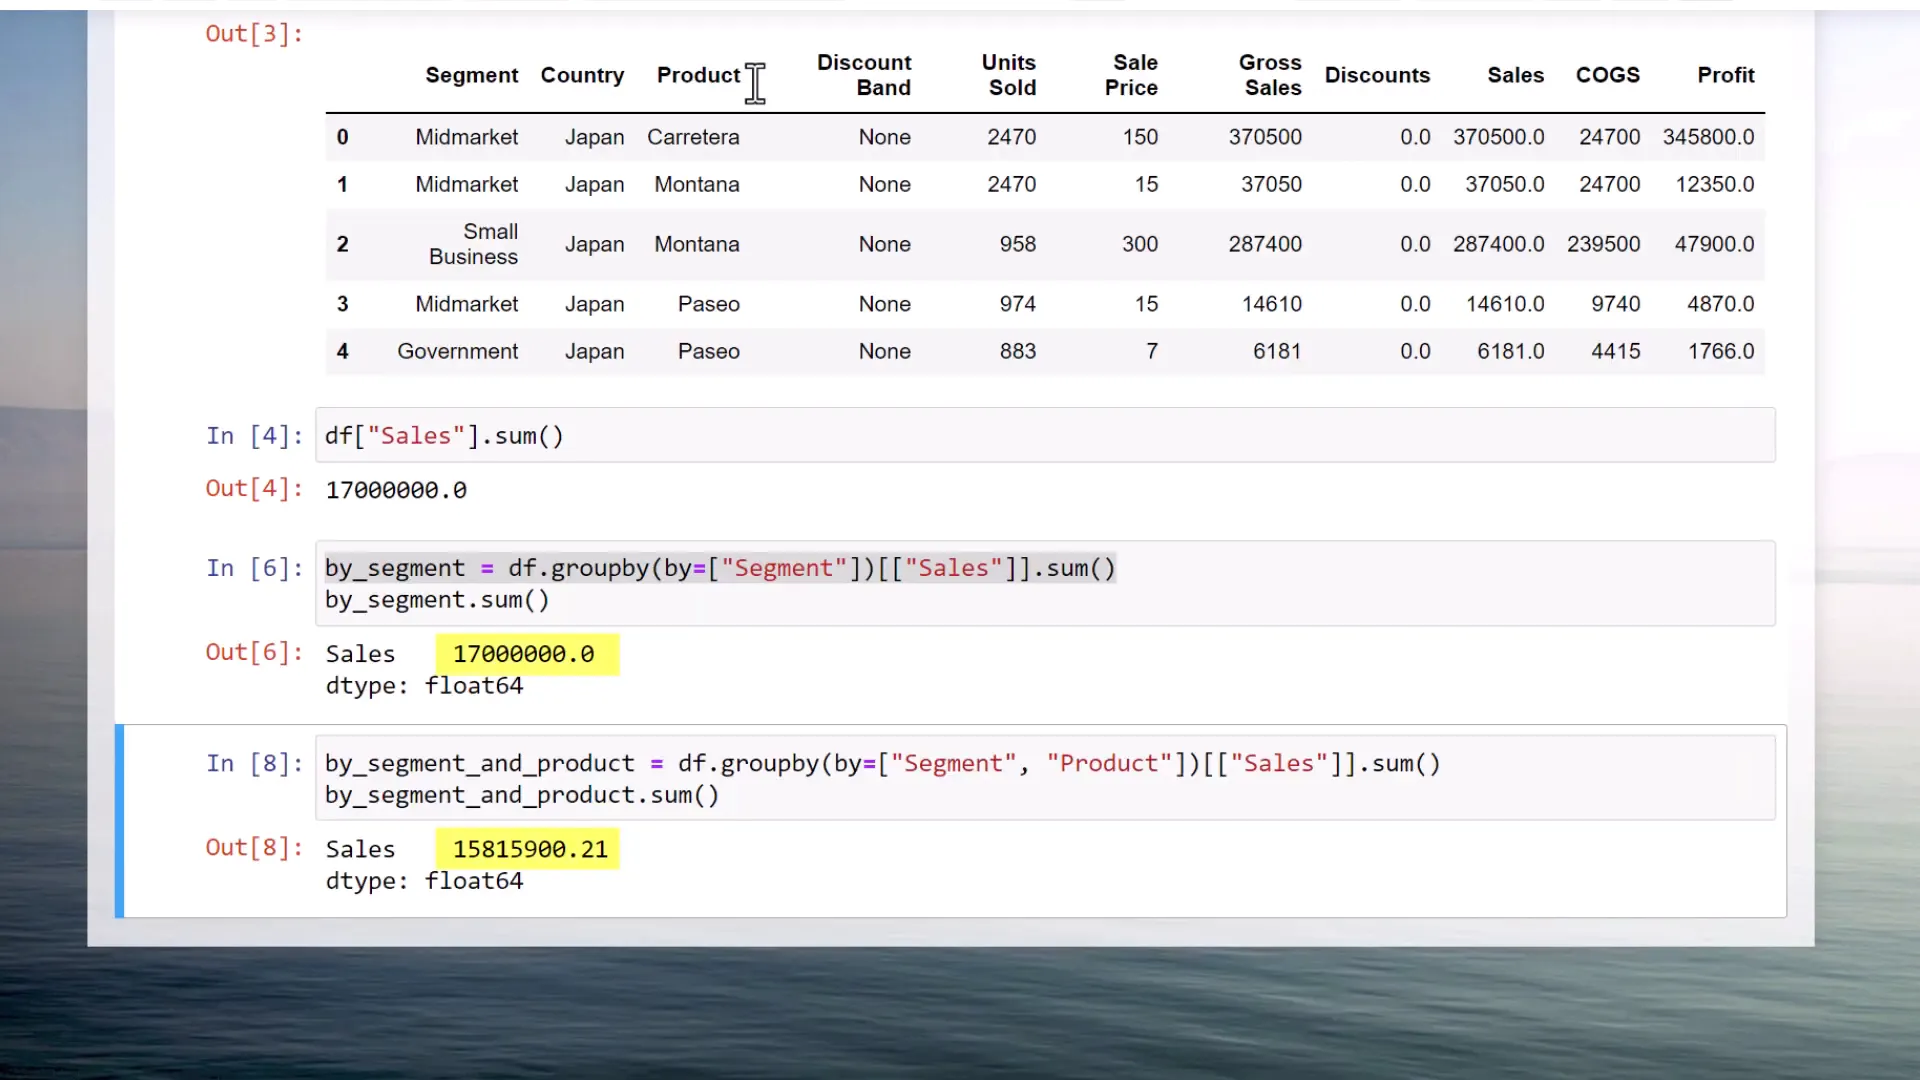
However, when I attempt to group the data by both segment and product, the results change. Running this cell gives me a new DataFrame, but now the total sales sum drops to 15.8 million. So, what’s going on?
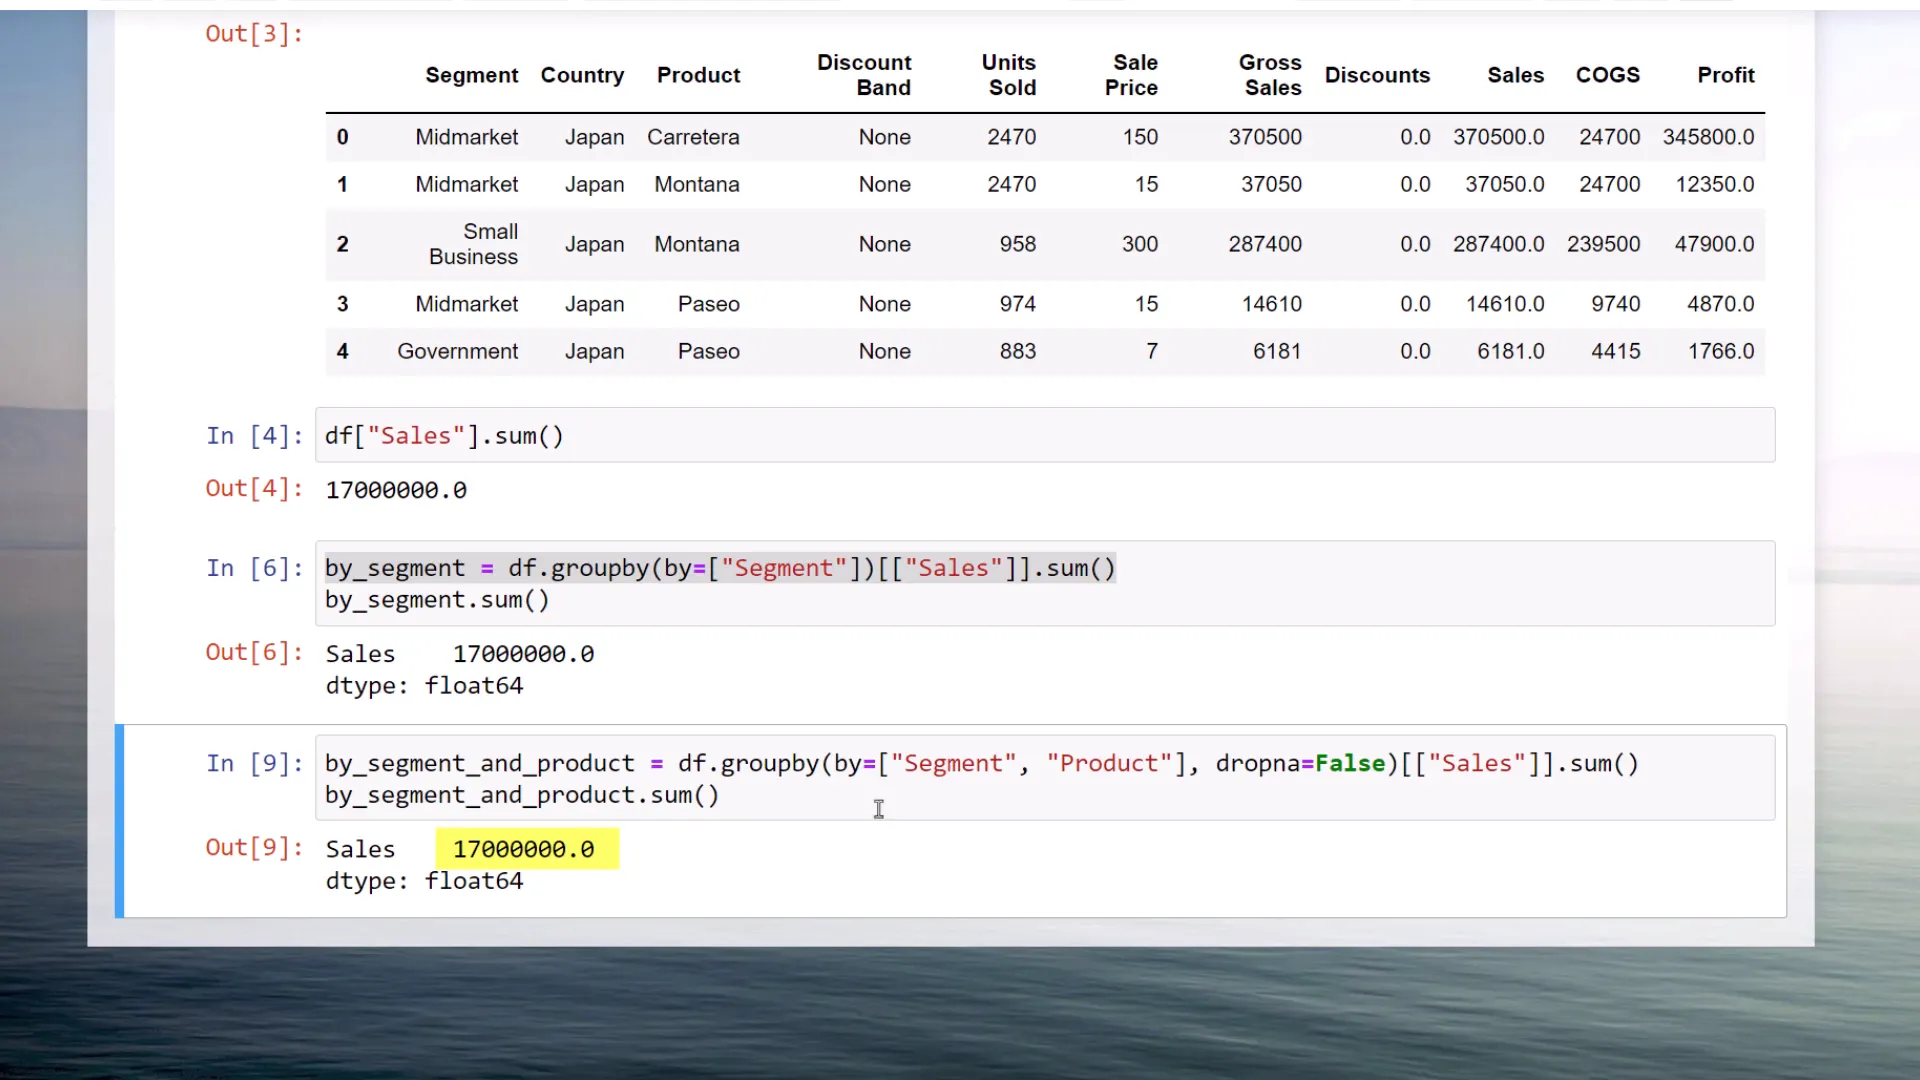
The issue lies in missing values. By default, Pandas drops any missing values when using the Groupby function. To prevent this from happening, you can set dropna to false.
After rerunning the cell with dropna set to false, the total sales return to 17 million. Upon inspecting the DataFrame further, I notice that some product names in the government segment are indeed missing.
Before grouping your DataFrame, it’s crucial to address any missing values. To check for missing values in your DataFrame, you can use the isna() function and then sum up all the boolean values. This will return an overview of missing values by column.
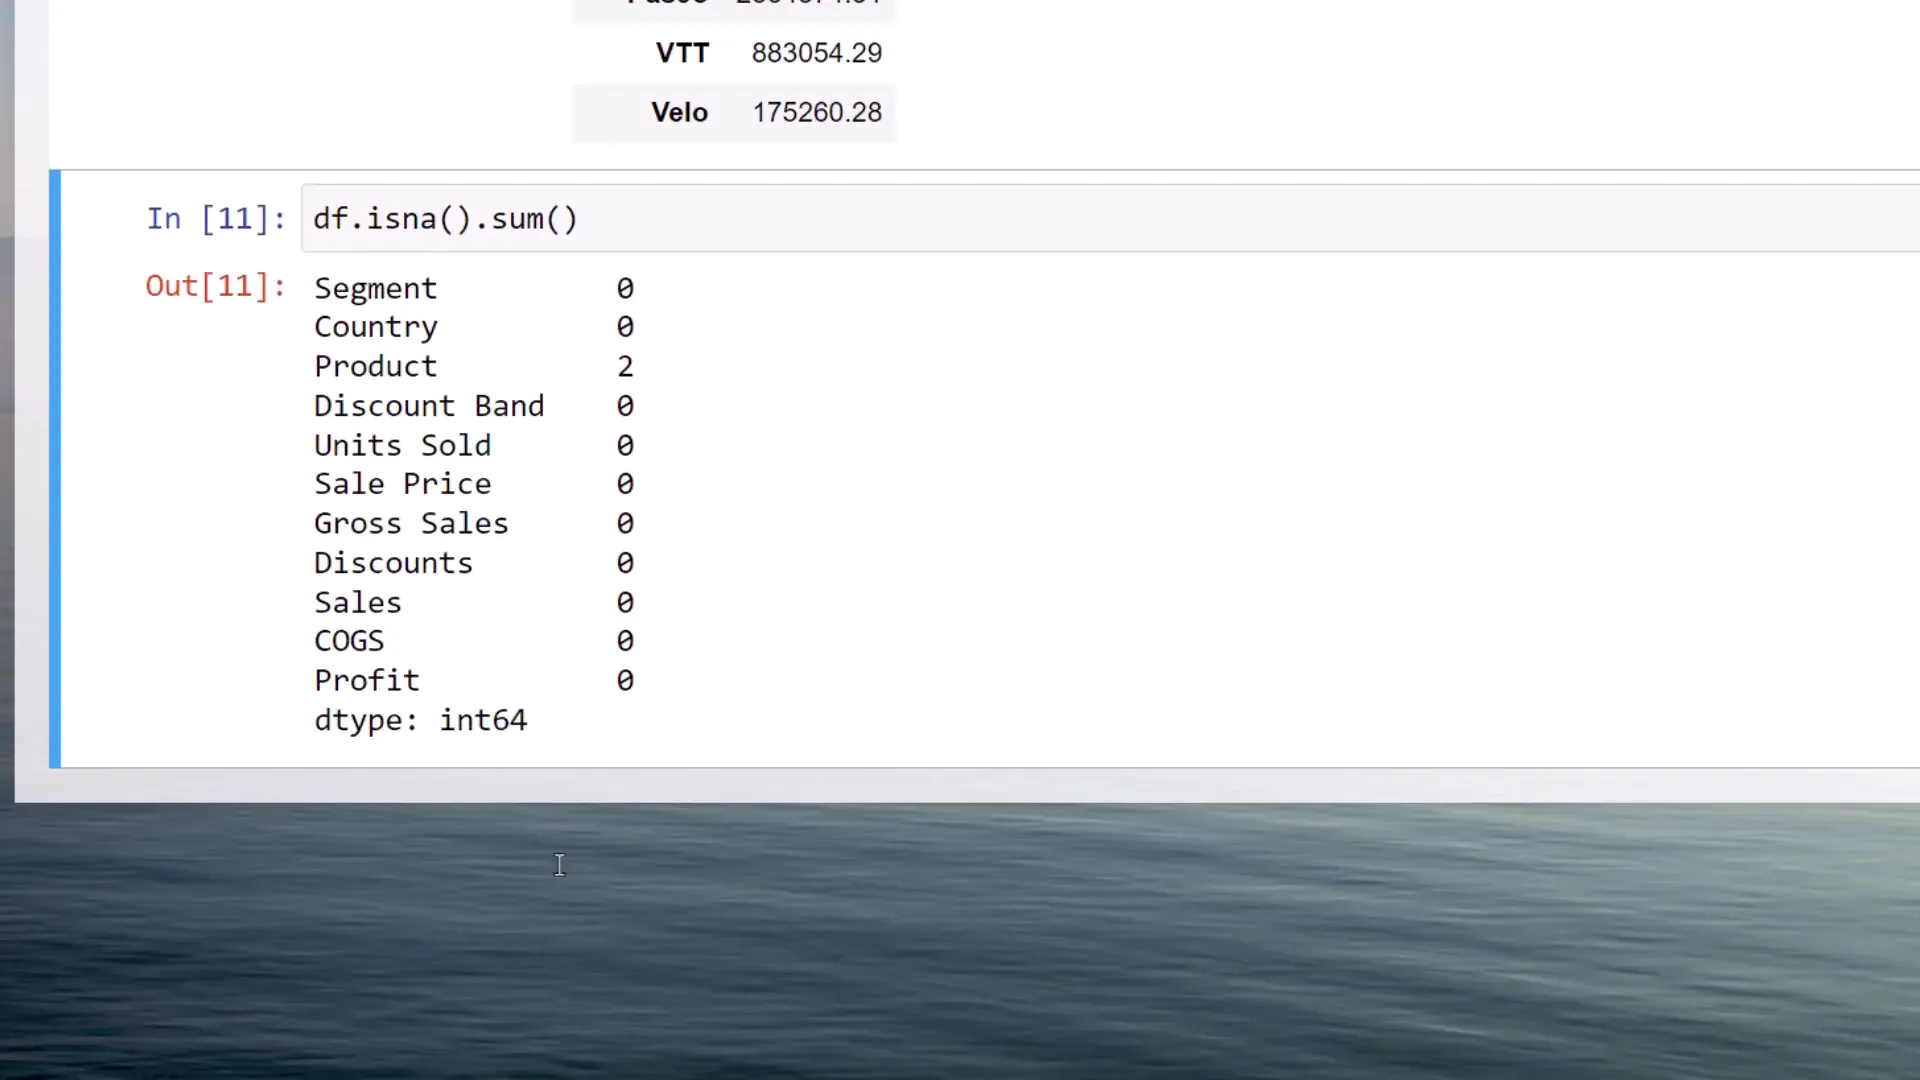
In my case, I find that there are two missing products. Another useful tip is to calculate the percentage of missing values. You can achieve this by taking the mean of isna() and multiplying the result by 100.

In this instance, the Product column has 1.9% of missing values. This simple check can save you from unexpected results when performing data analysis.
In conclusion, always ensure to handle missing values before performing group operations in Pandas. It can make a significant difference in your analysis results.