I Built an AI Chart Analyzer for Excel (FREE Code Inside!)
Introduction
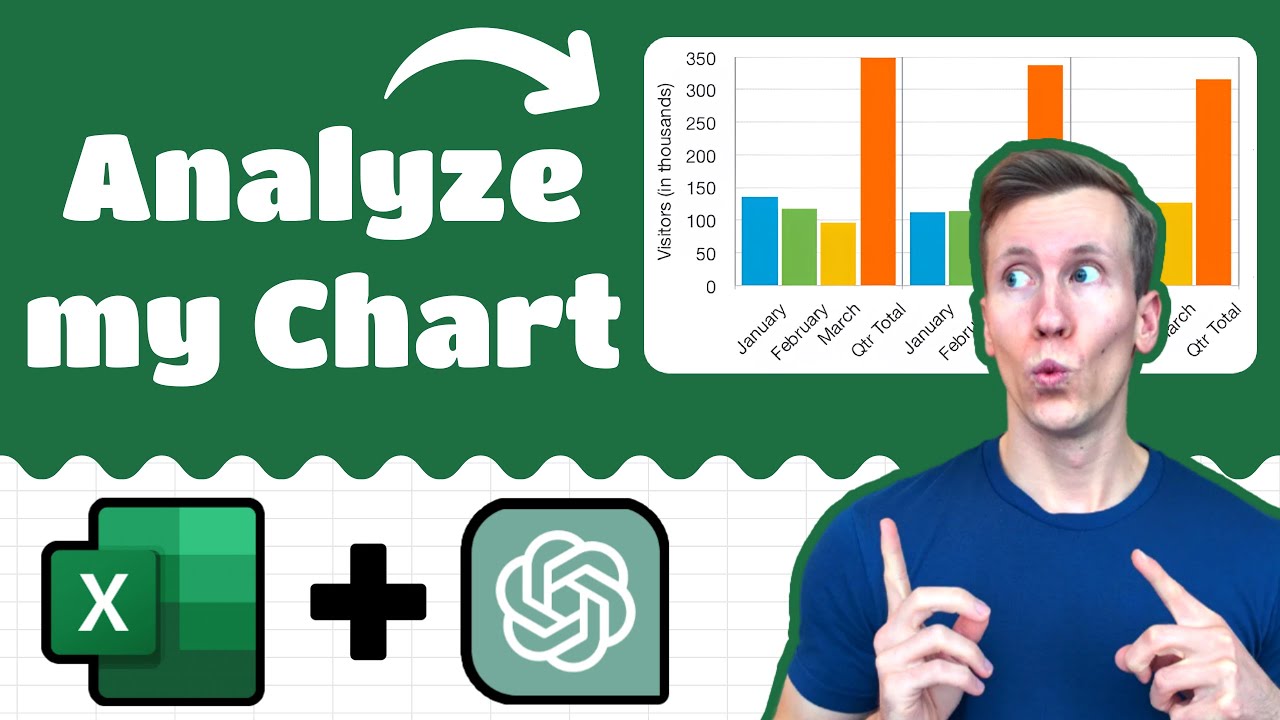
In this blog, we will explore how to set up an AI-powered chart and image analyzer for Excel. This tool allows users to select charts or images, input prompts, and receive instant insights, streamlining the data analysis process. Follow along to learn how to implement this innovative solution in your Excel workbooks.
How to Set It Up
Setting up the AI chart and image analyzer involves several key steps that are essential to ensure smooth operation. Below, we will outline the process from downloading necessary files to configuring your Excel environment.
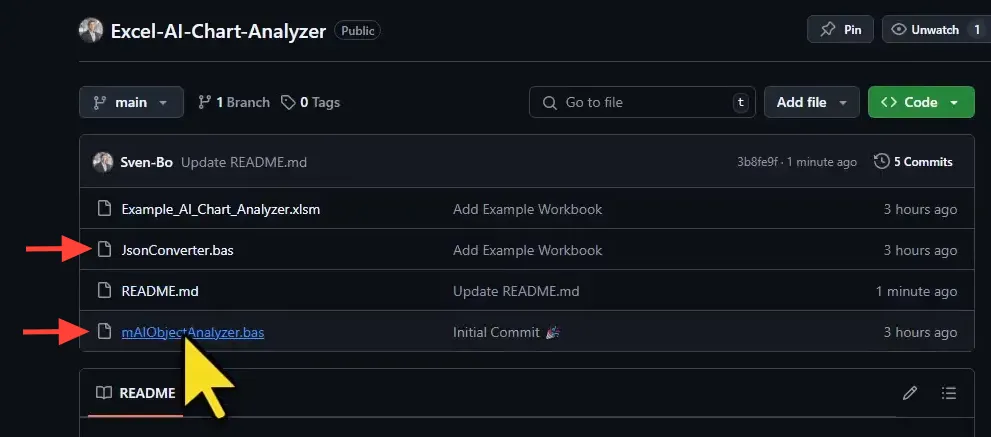
- Download Required Modules: Start by downloading two essential modules from the provided GitHub repository. The first is the JSON converter, and the second is the Object Analyzer module. These modules form the backbone of the functionality of your analyzer.
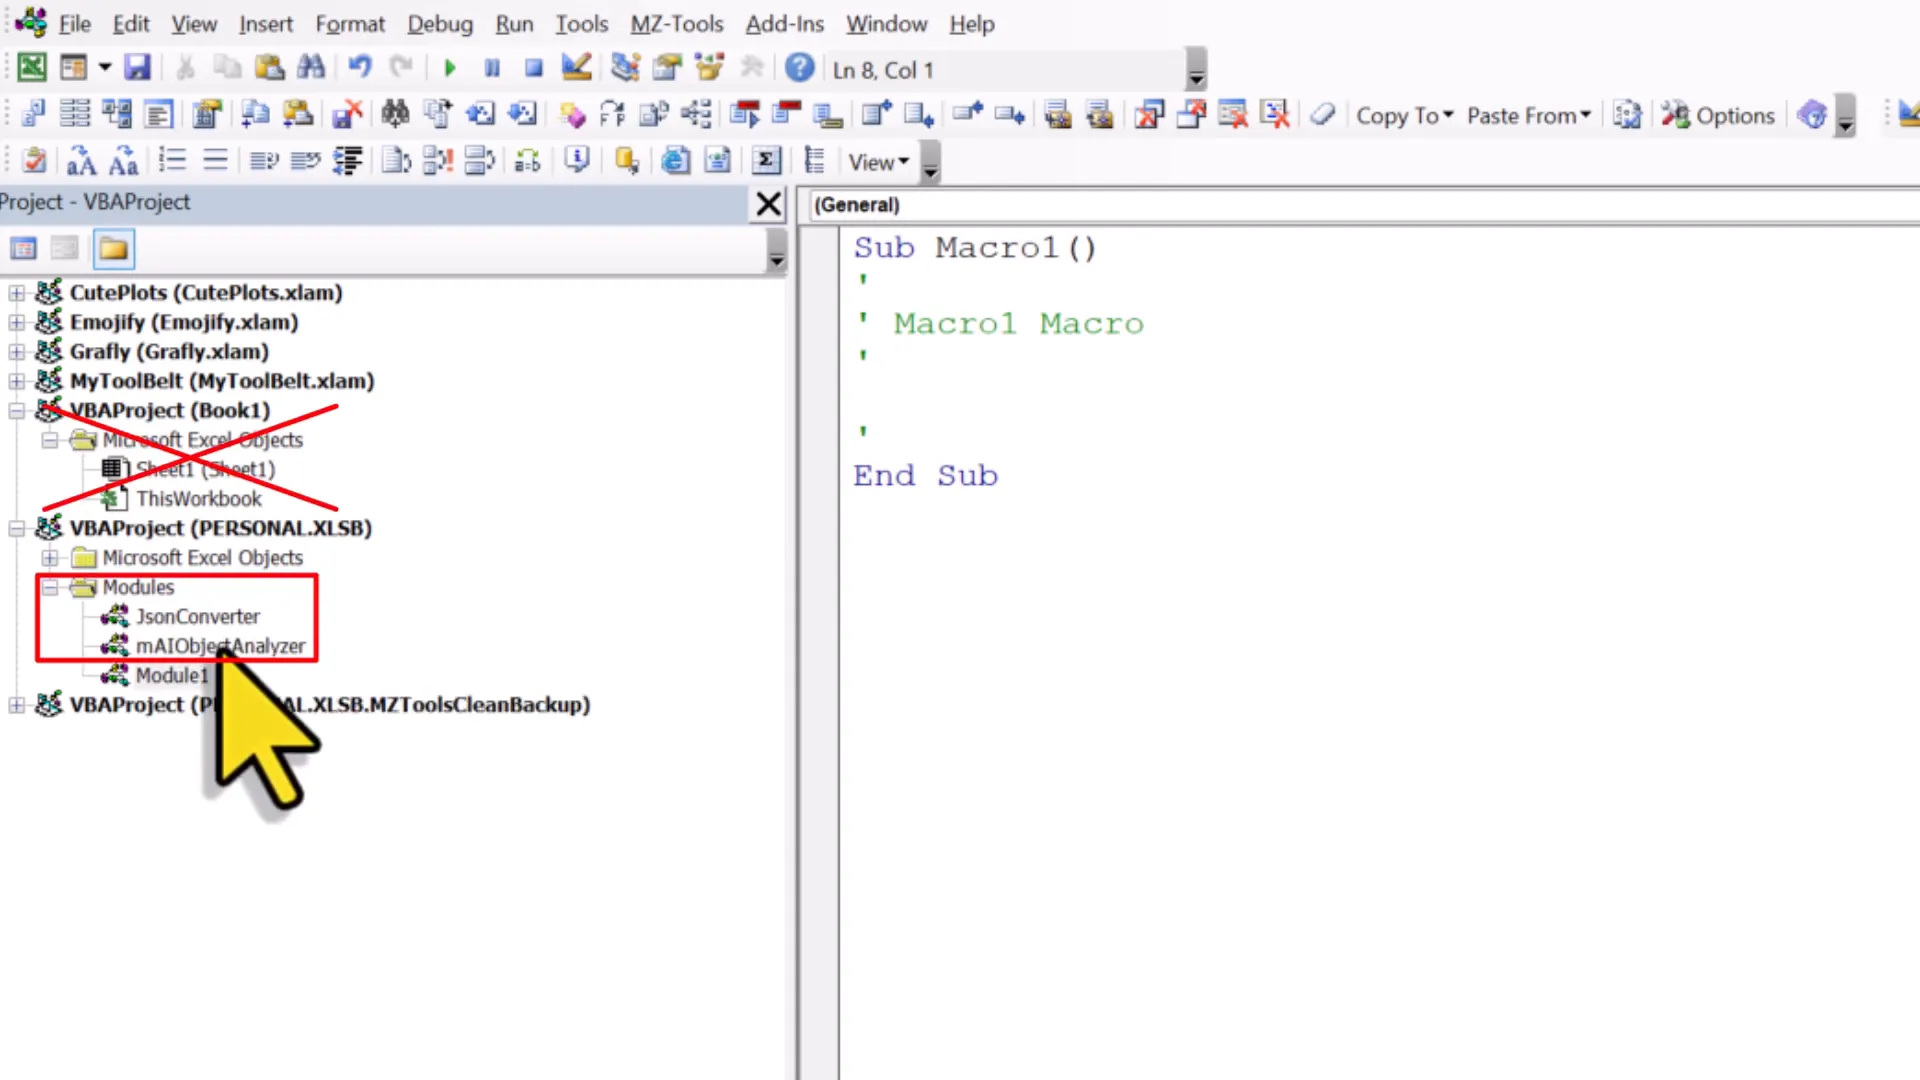
- Create a Personal Macro Workbook: To use the VBA code across all workbooks, you need to create a personal macro workbook. Access the Developer tab in Excel, record a macro, and choose to save it in your personal macro workbook.

- Add Modules to Your Personal Workbook: After creating the personal workbook, drag the downloaded modules into it. Ensure that you are placing them in the correct workbook.
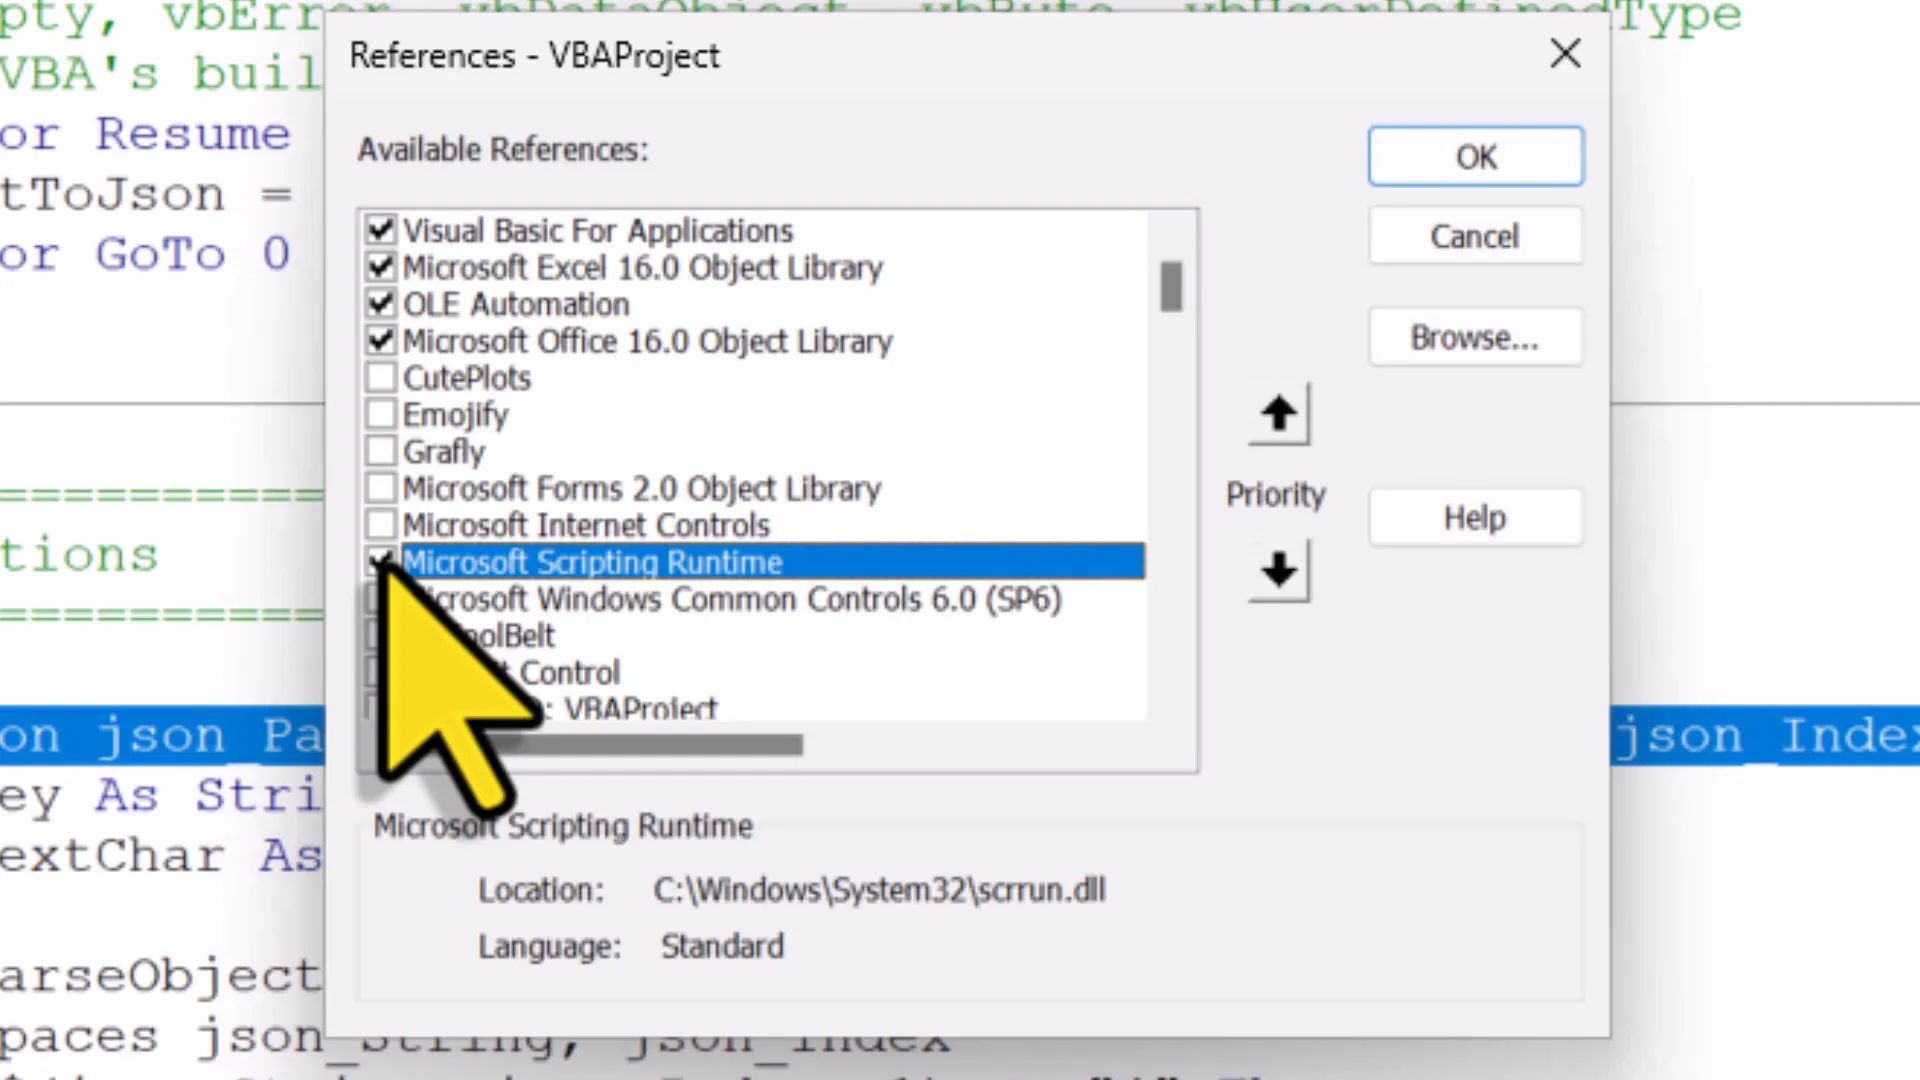
- Activate Microsoft Scripting Runtime: The JSON converter requires the Microsoft Scripting Runtime. Check if it’s active in the Visual Basic editor by going to ‘Tools’ and selecting ‘References’. If it’s not checked, enable it.
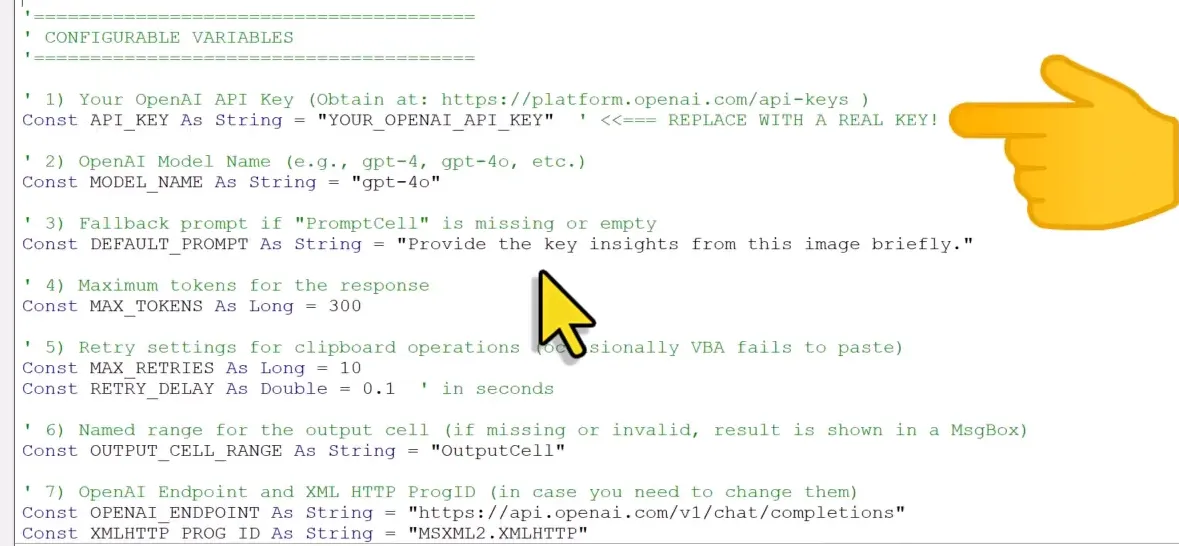
- Insert Your OpenAI API Key: Access the Object Analyzer module and insert your OpenAI API key. This key is critical for connecting to the AI service that provides insights based on your data.
Add Input and Output Cells
To maximize the functionality of your AI chart and image analyzer, setting up designated input and output cells is crucial. This allows for a streamlined process where you can input prompts and receive outputs directly within your Excel sheet.
- Prepare Input and Output Cells: Designate two cells in your spreadsheet—one for entering prompts and the other for displaying output responses. This setup enhances usability and keeps your workflow organized.
- Name Your Cells: Click on the input cell and assign it a name, such as ‘prompt cell’. Do the same for the output cell, naming it ‘output cell’. This step is vital for the code to reference these cells accurately.
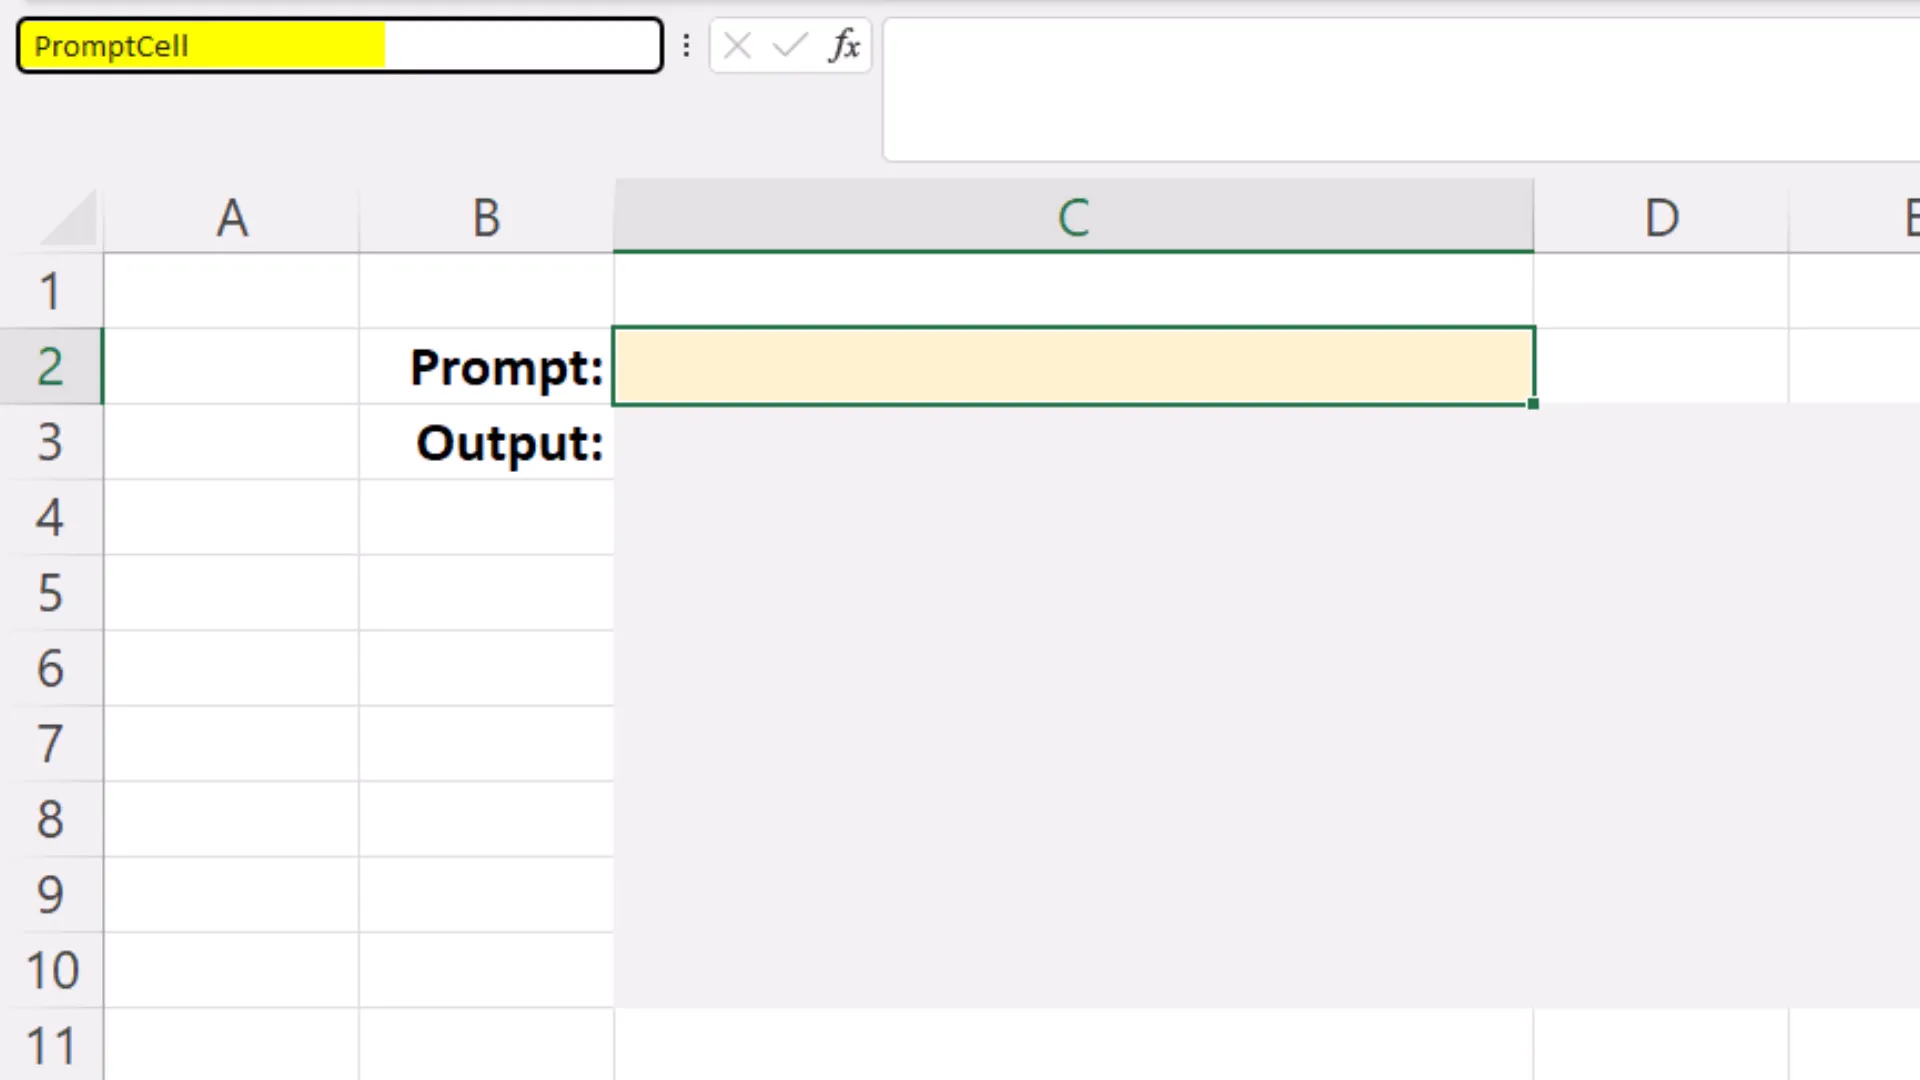
- Utilize the Cells: Once your cells are named, you can type your prompt directly into the input cell. When you activate the AI analyzer, it will pull the prompt from this cell, and the output will populate the designated output cell.

By following these steps, you will establish a robust framework for analyzing charts and images in Excel, significantly enhancing your data analysis capabilities. With this setup, you are now ready to explore various functionalities that the AI chart and image analyzer offers.
Save the Personal Workbook
Once you have completed setting up your personal macro workbook, it is essential to save it properly. The personal macro workbook acts as a repository for your macros, making them accessible across all your Excel files. To save your personal workbook:
- Close Excel: When you close your current workbook, Excel will prompt you to save changes. Make sure to click ‘Don’t Save’ for the current workbook if you don’t need it.
- Save Personal Workbook: Excel will then prompt you to save changes to your personal workbook. Click ‘Save’ to ensure your macros are stored for future use.
- Confirm Saving: After clicking ‘Save’, a confirmation message may appear. Ensure that you acknowledge this to prevent losing any changes.

Add Macro to Quick Access Toolbar
Integrating the macro into the Quick Access Toolbar (QAT) provides easy access, allowing you to run the AI chart analyzer with a single click. Here’s how to add your macro to the QAT:
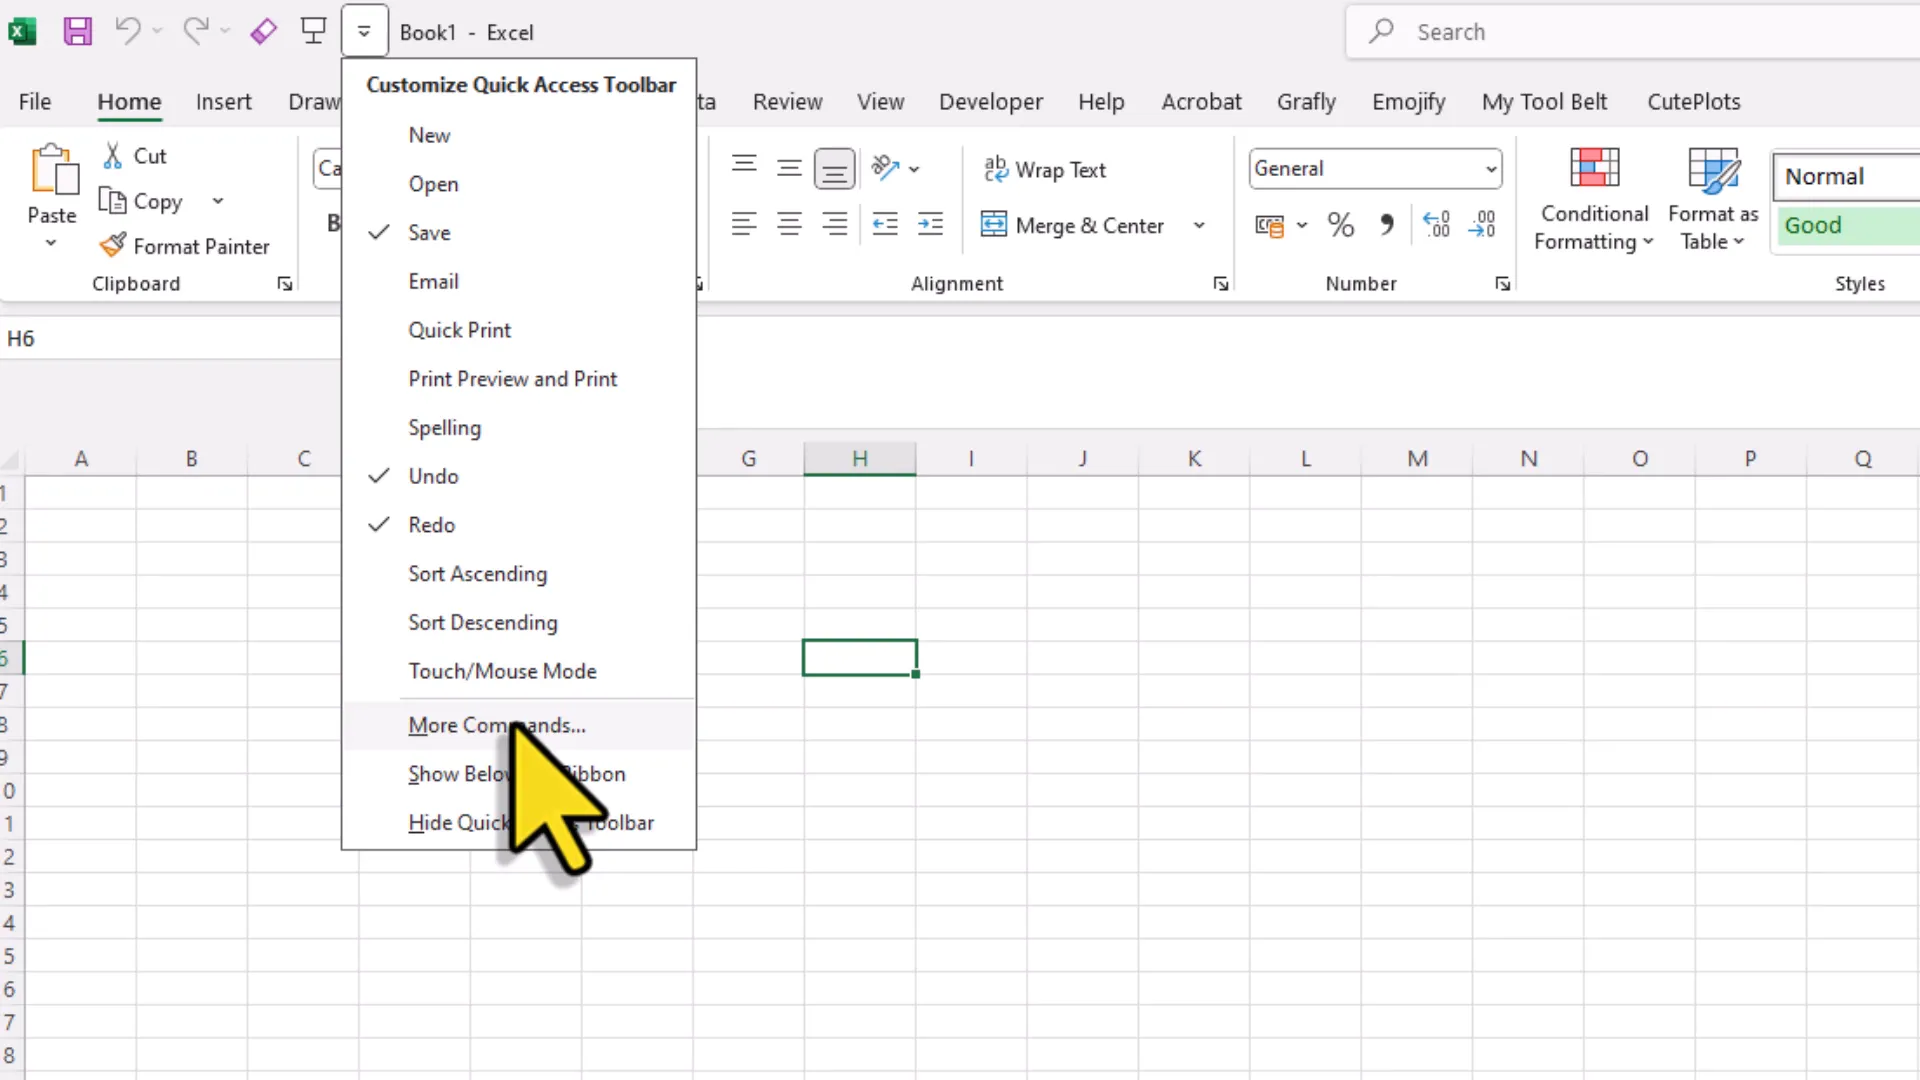
- Open Quick Access Toolbar Settings: Click the down arrow on the Quick Access Toolbar and select ‘More Commands’.
- Select Macro: In the ‘Choose commands from’ dropdown, select ‘Macros’. You will see the Object Analyzer module listed.
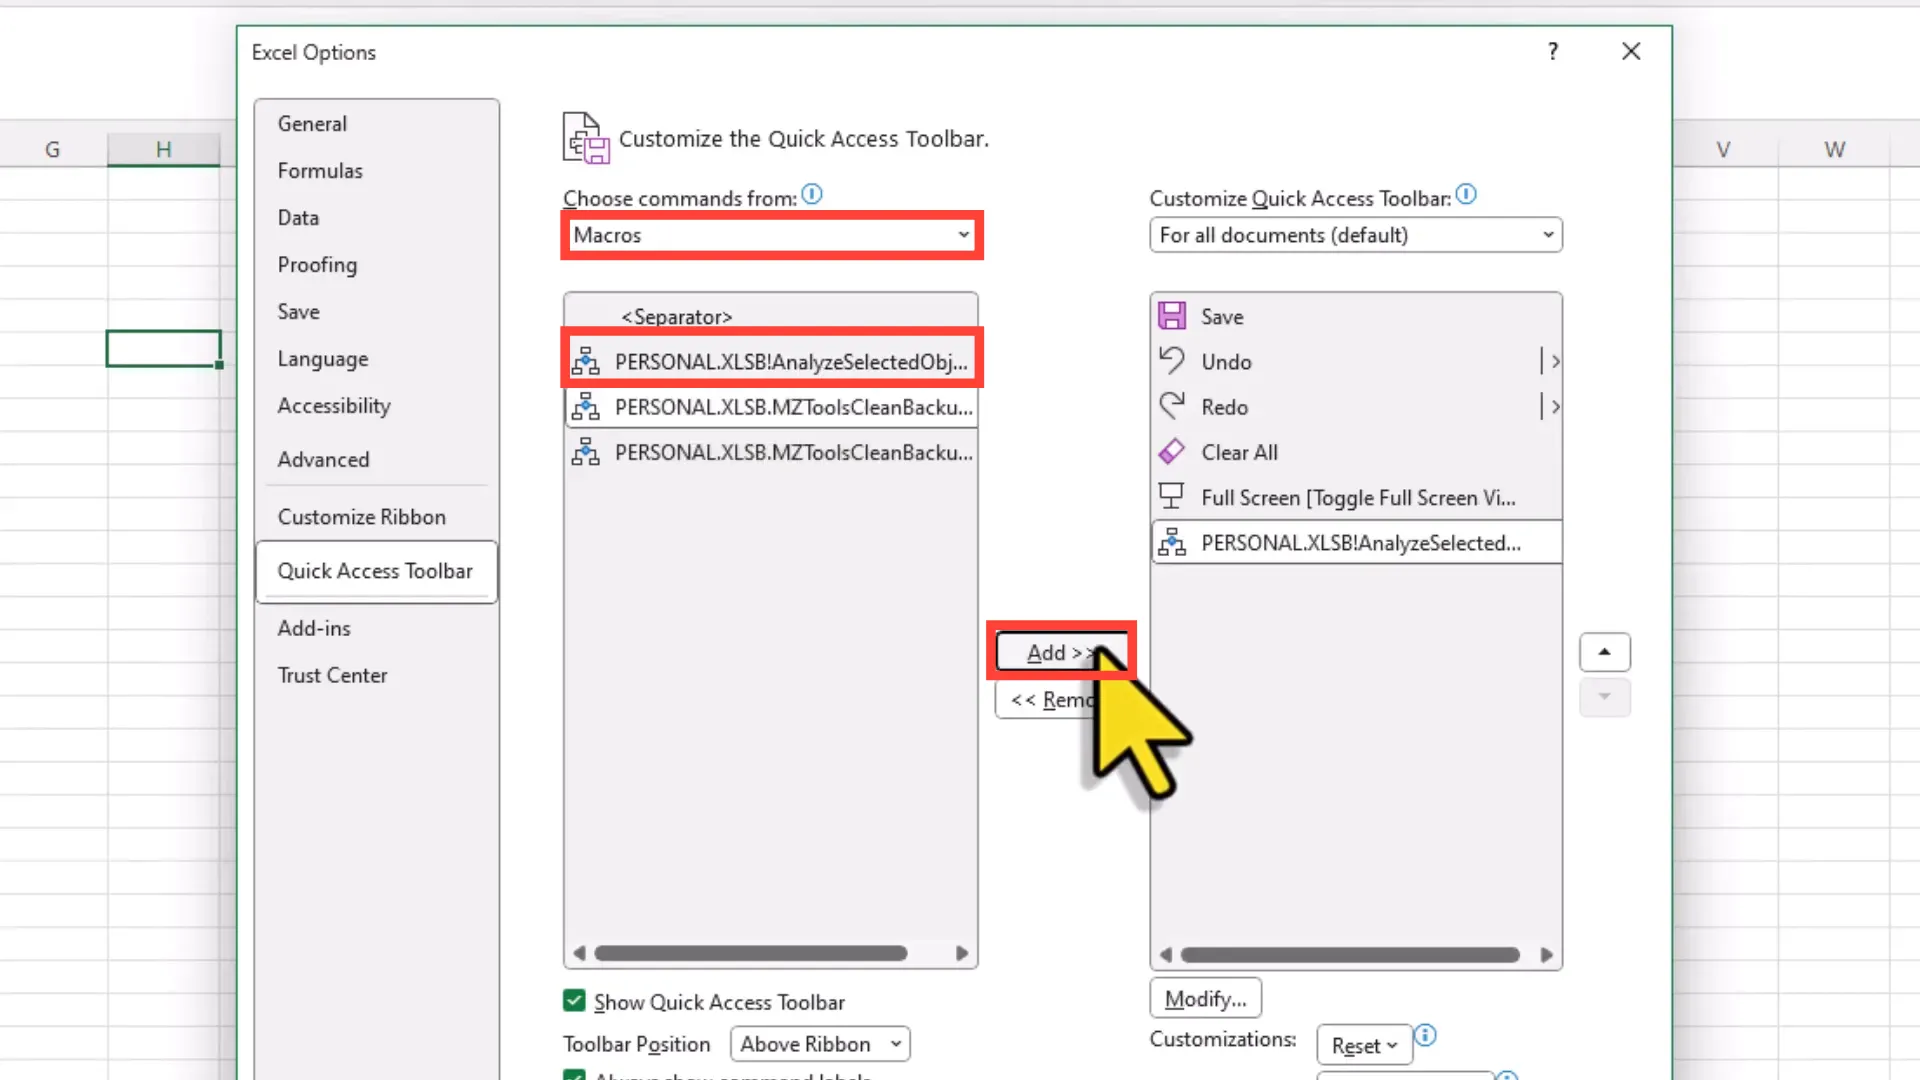
- Add to Toolbar: Select your macro and click ‘Add’ to move it to the right side of the window. You can also click on ‘Modify’ to change the icon if desired.
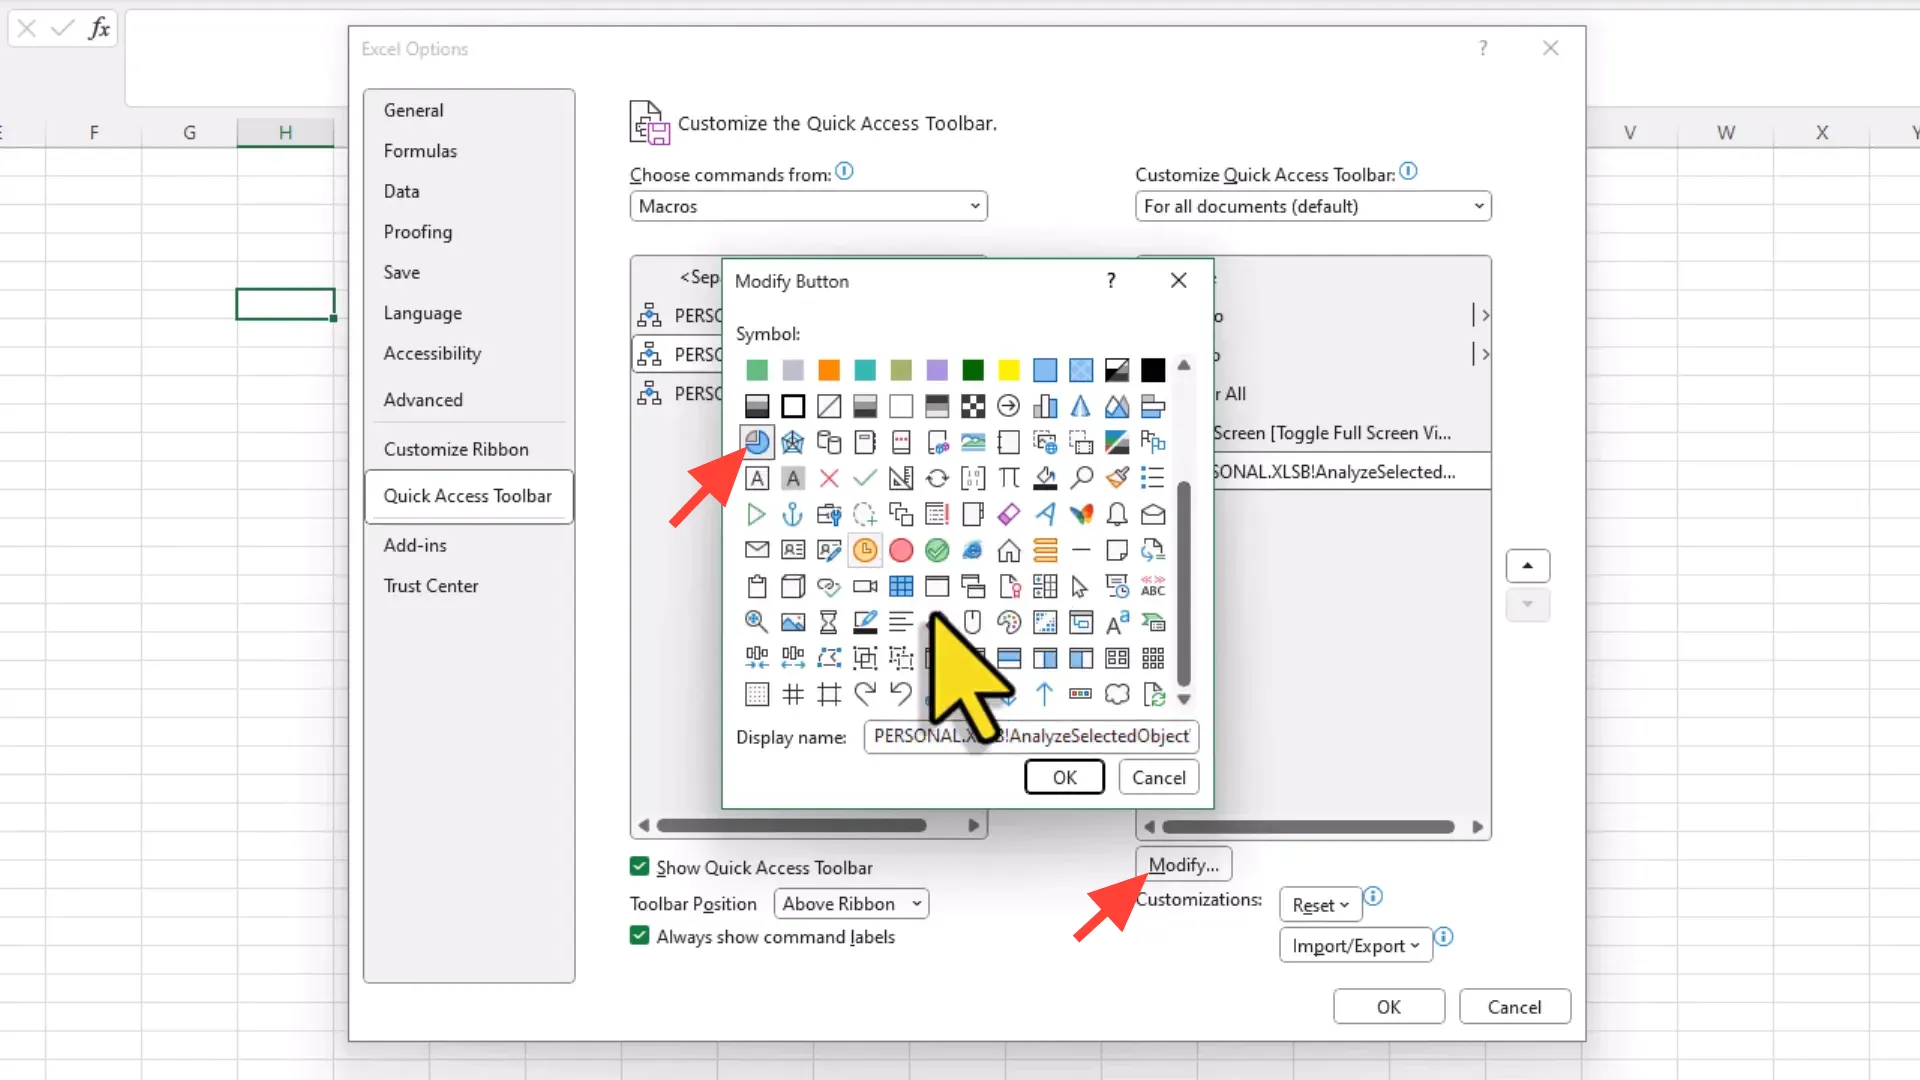
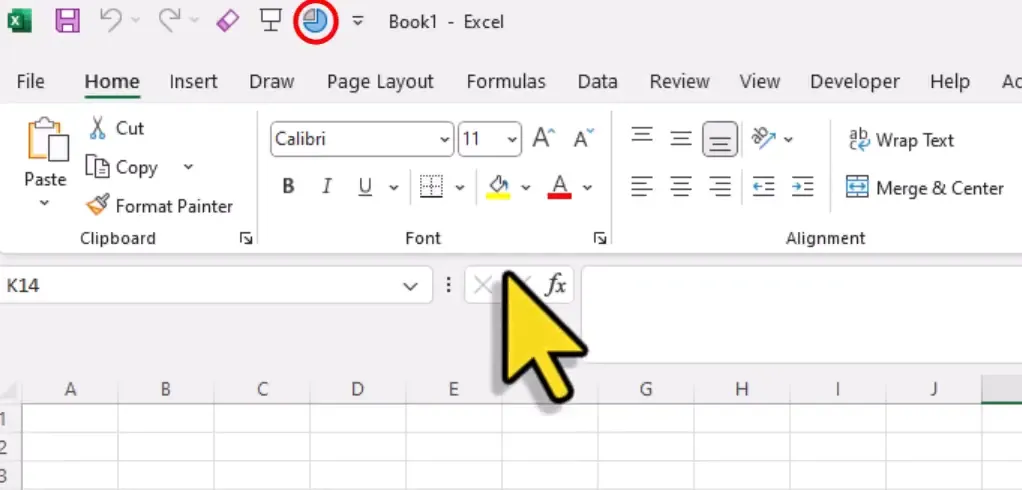
- Finish Setup: Once you are done, click ‘OK’ to finalize the changes. Your macro will now be accessible from the QAT.
Code Walkthrough
Understanding the underlying code of your AI chart analyzer is vital for troubleshooting and customization. The code consists of several key components:
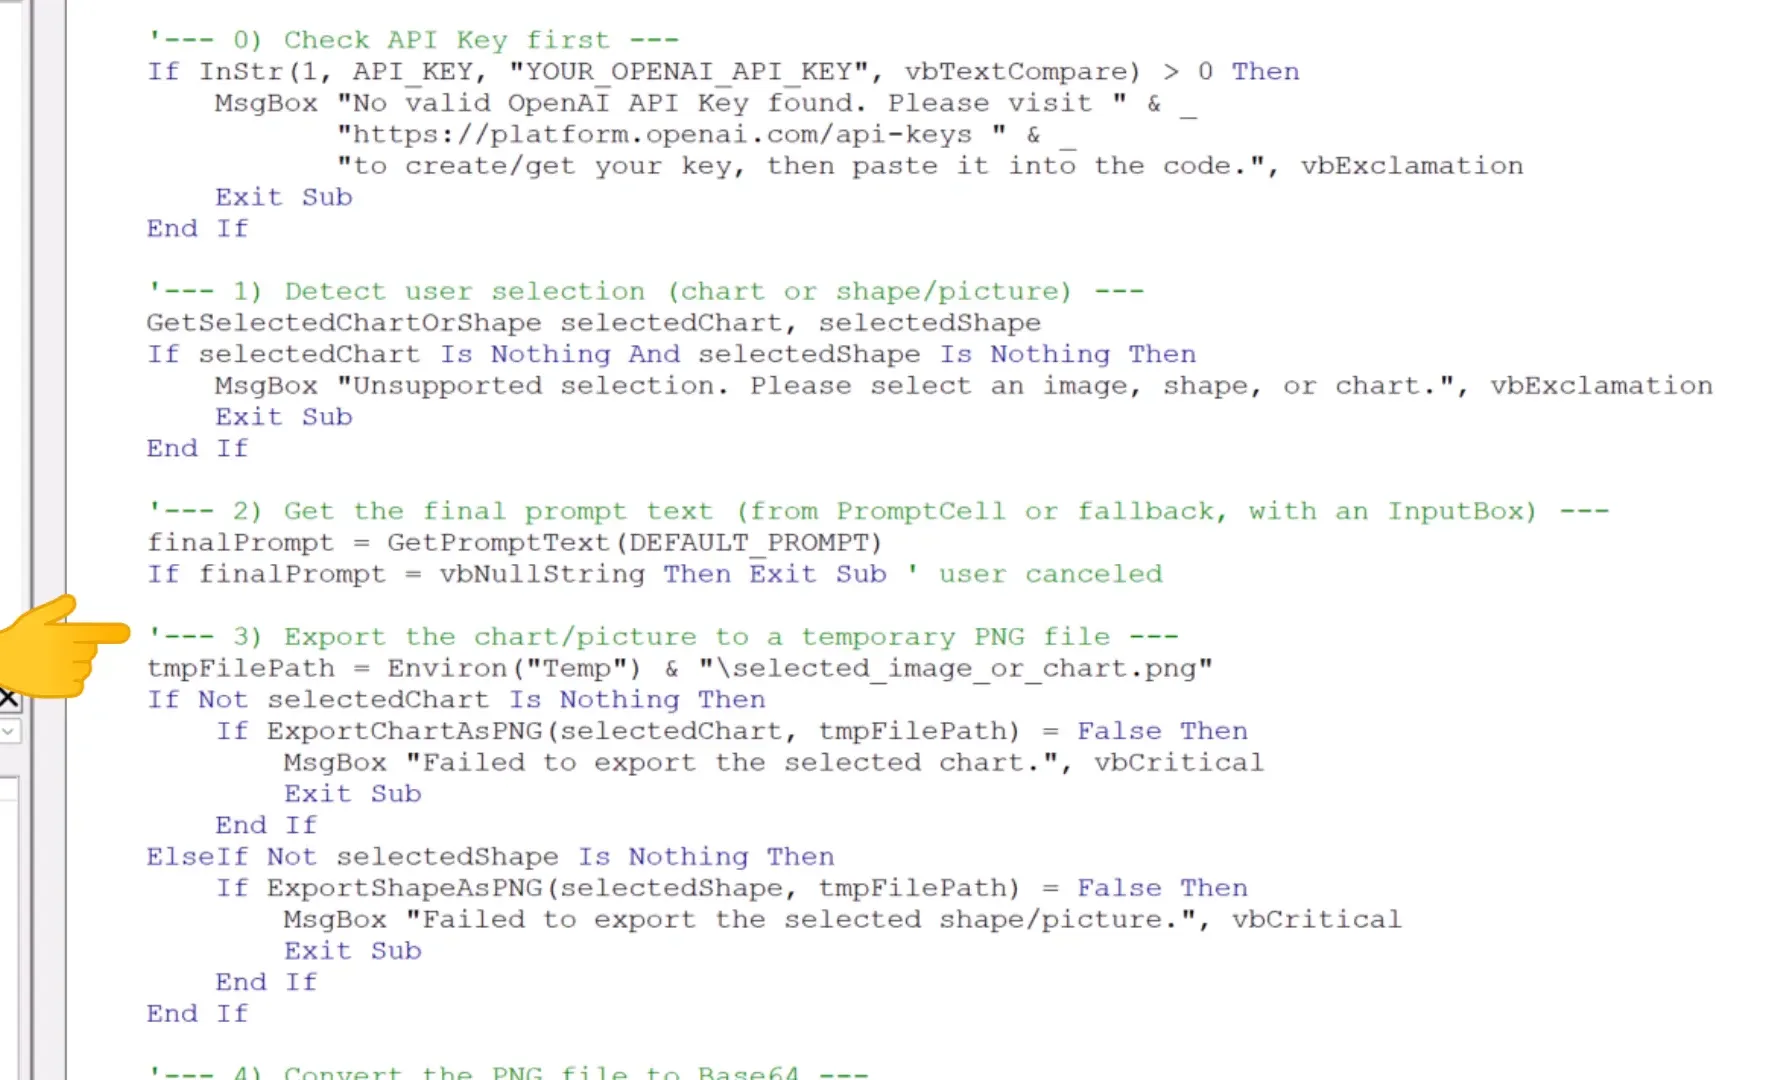
- Initialization: The macro begins by checking if the OpenAI API key has been correctly inserted. This step is crucial for establishing a connection with the API.
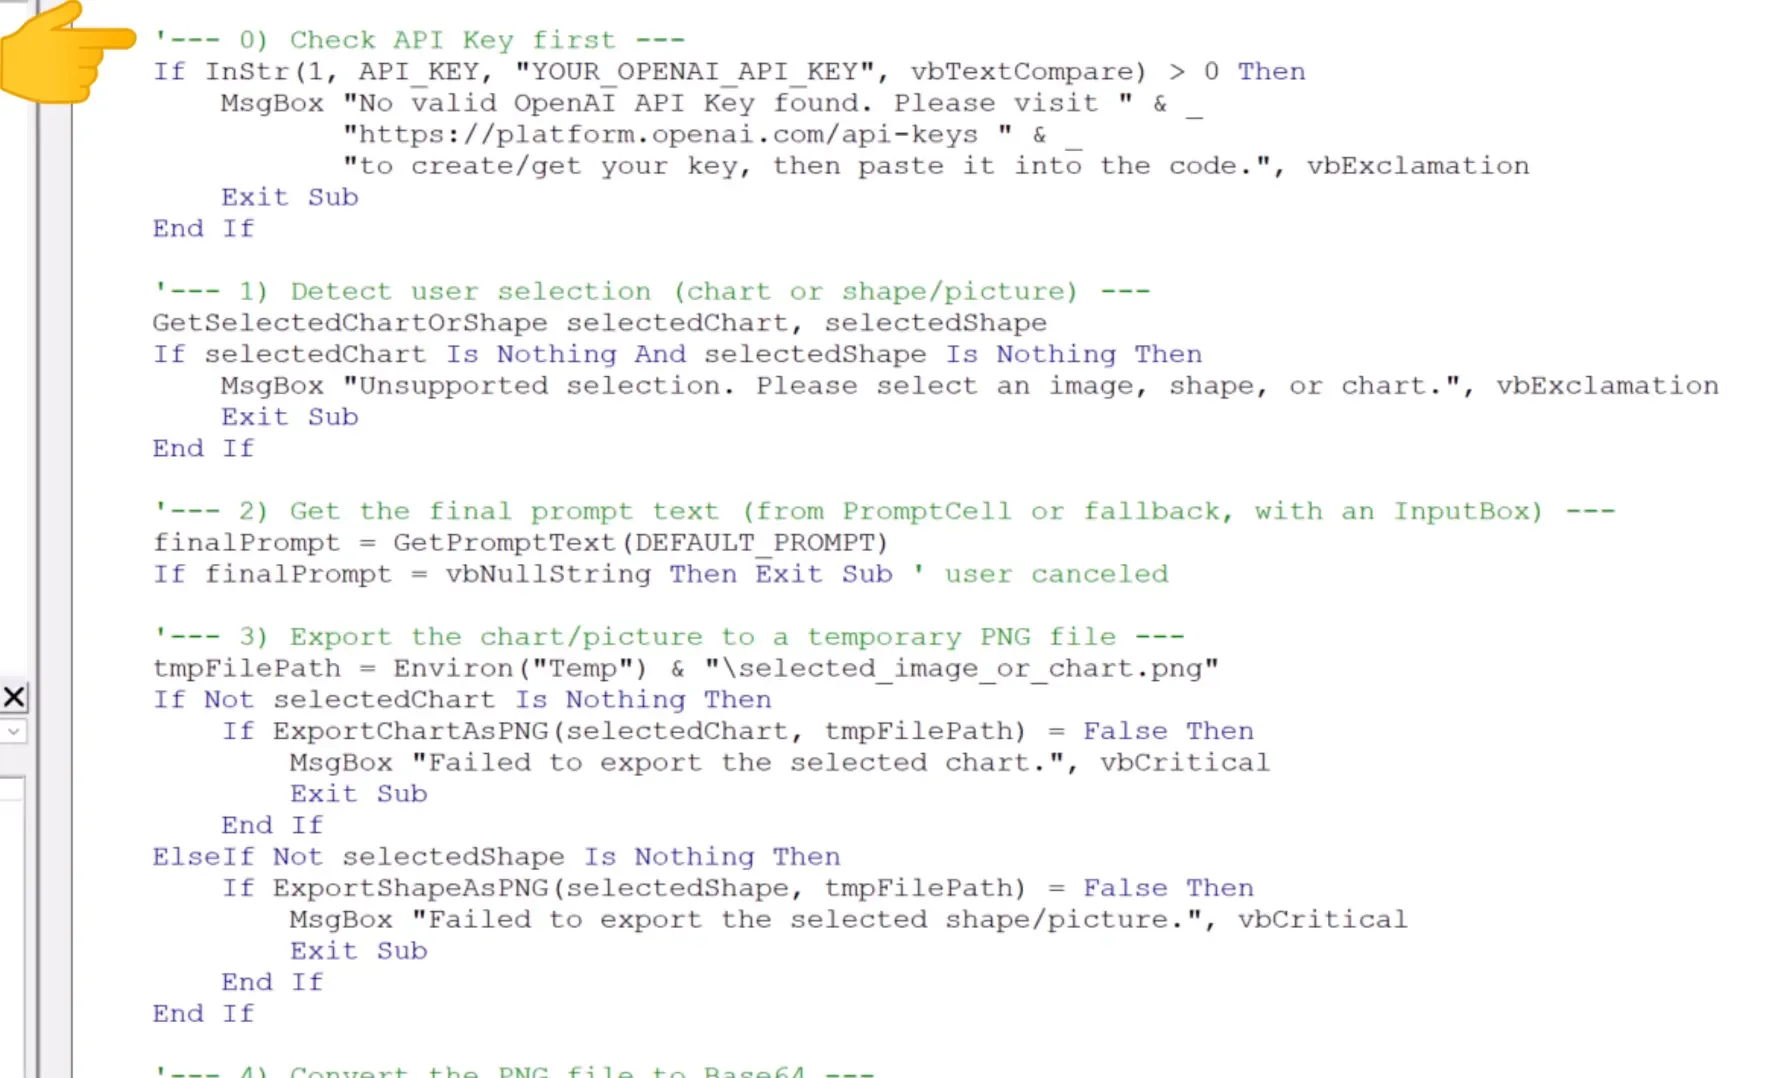
- Selection Verification: The code checks whether a chart or image is selected. If nothing is selected, an error message prompts the user to make a selection.

- Prompt Retrieval: The analyzer retrieves the prompt either from the designated prompt cell or via an input box, making it flexible for user input.
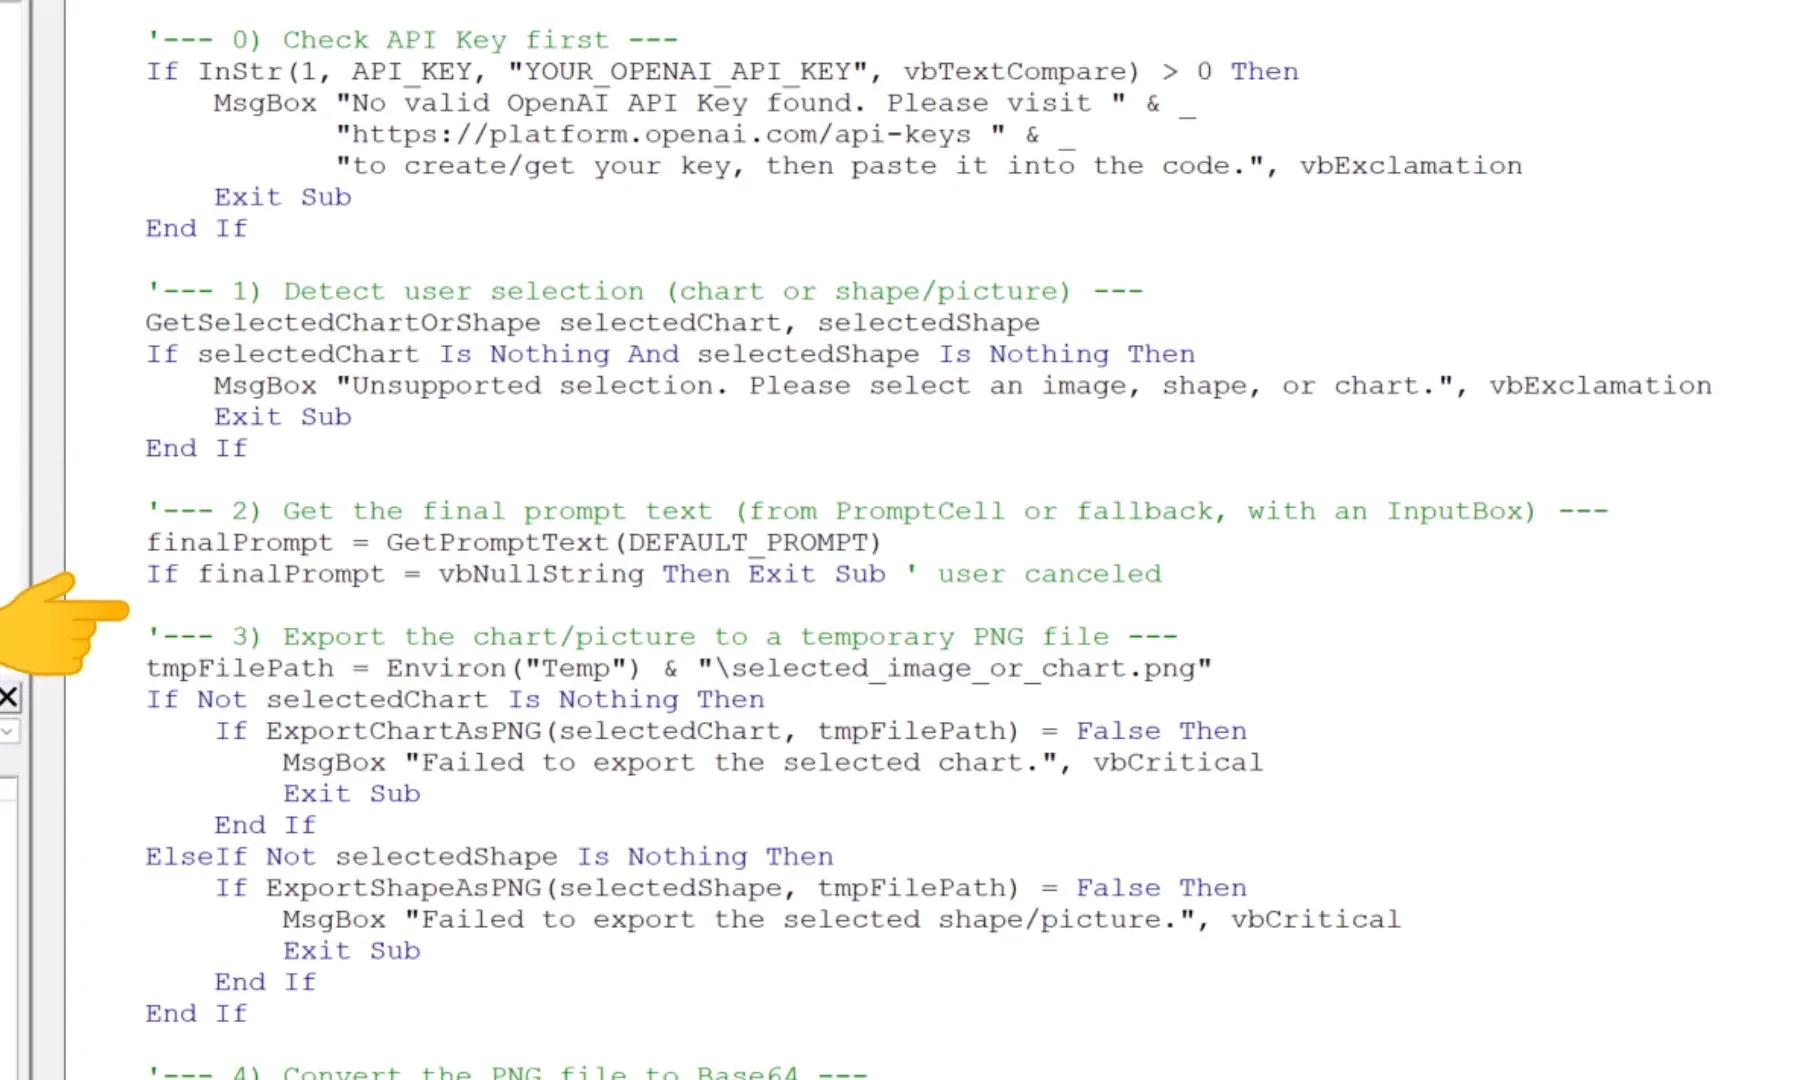
- Image Export: The selected chart or image is exported as a temporary image file. This image is then encoded in base64 format, which is required for the API request.
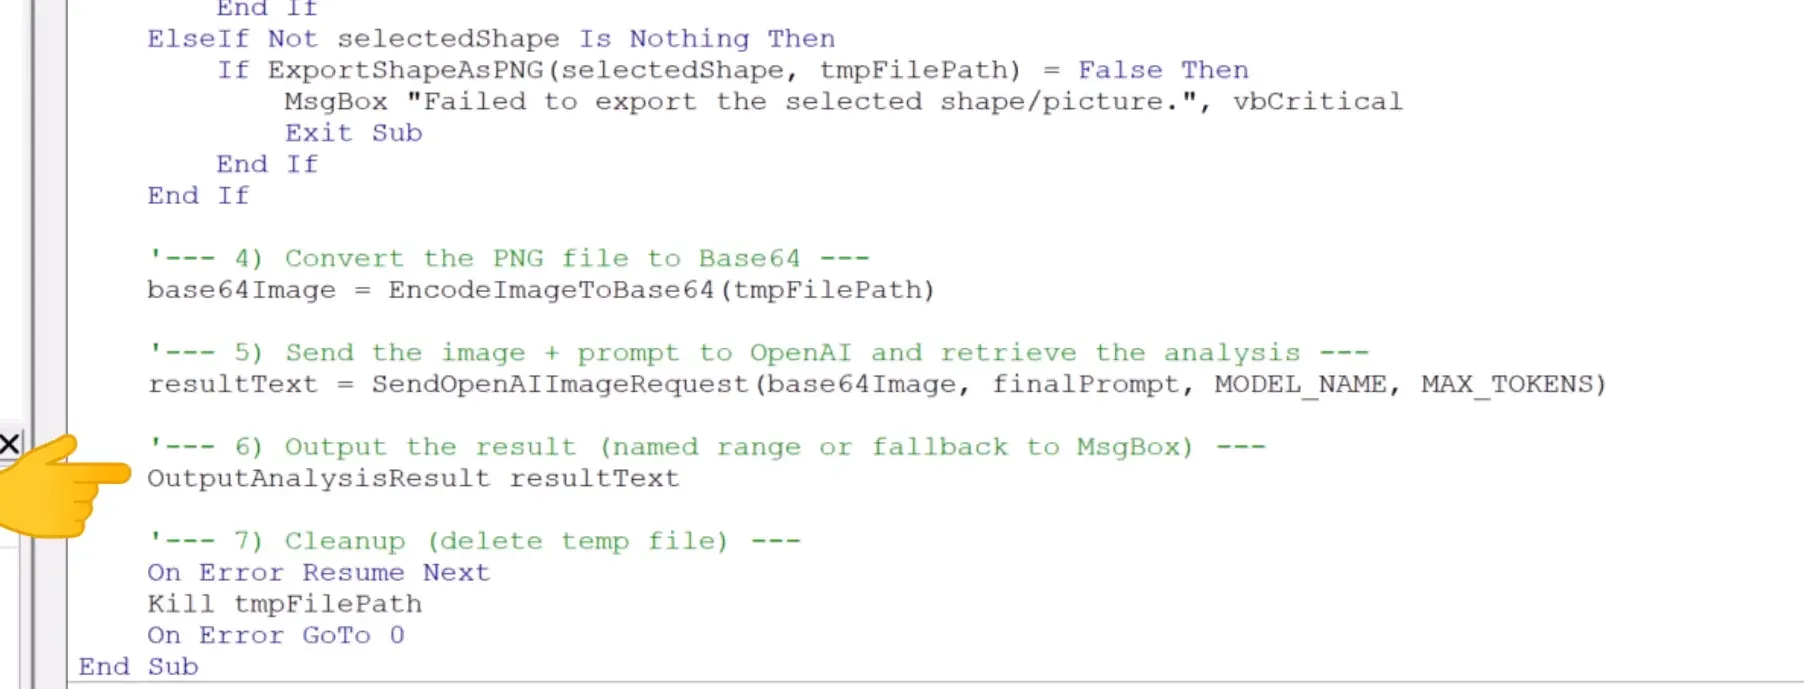
- API Interaction: The encoded image is sent to the OpenAI API, which processes the request and returns an insightful response based on the provided prompt.
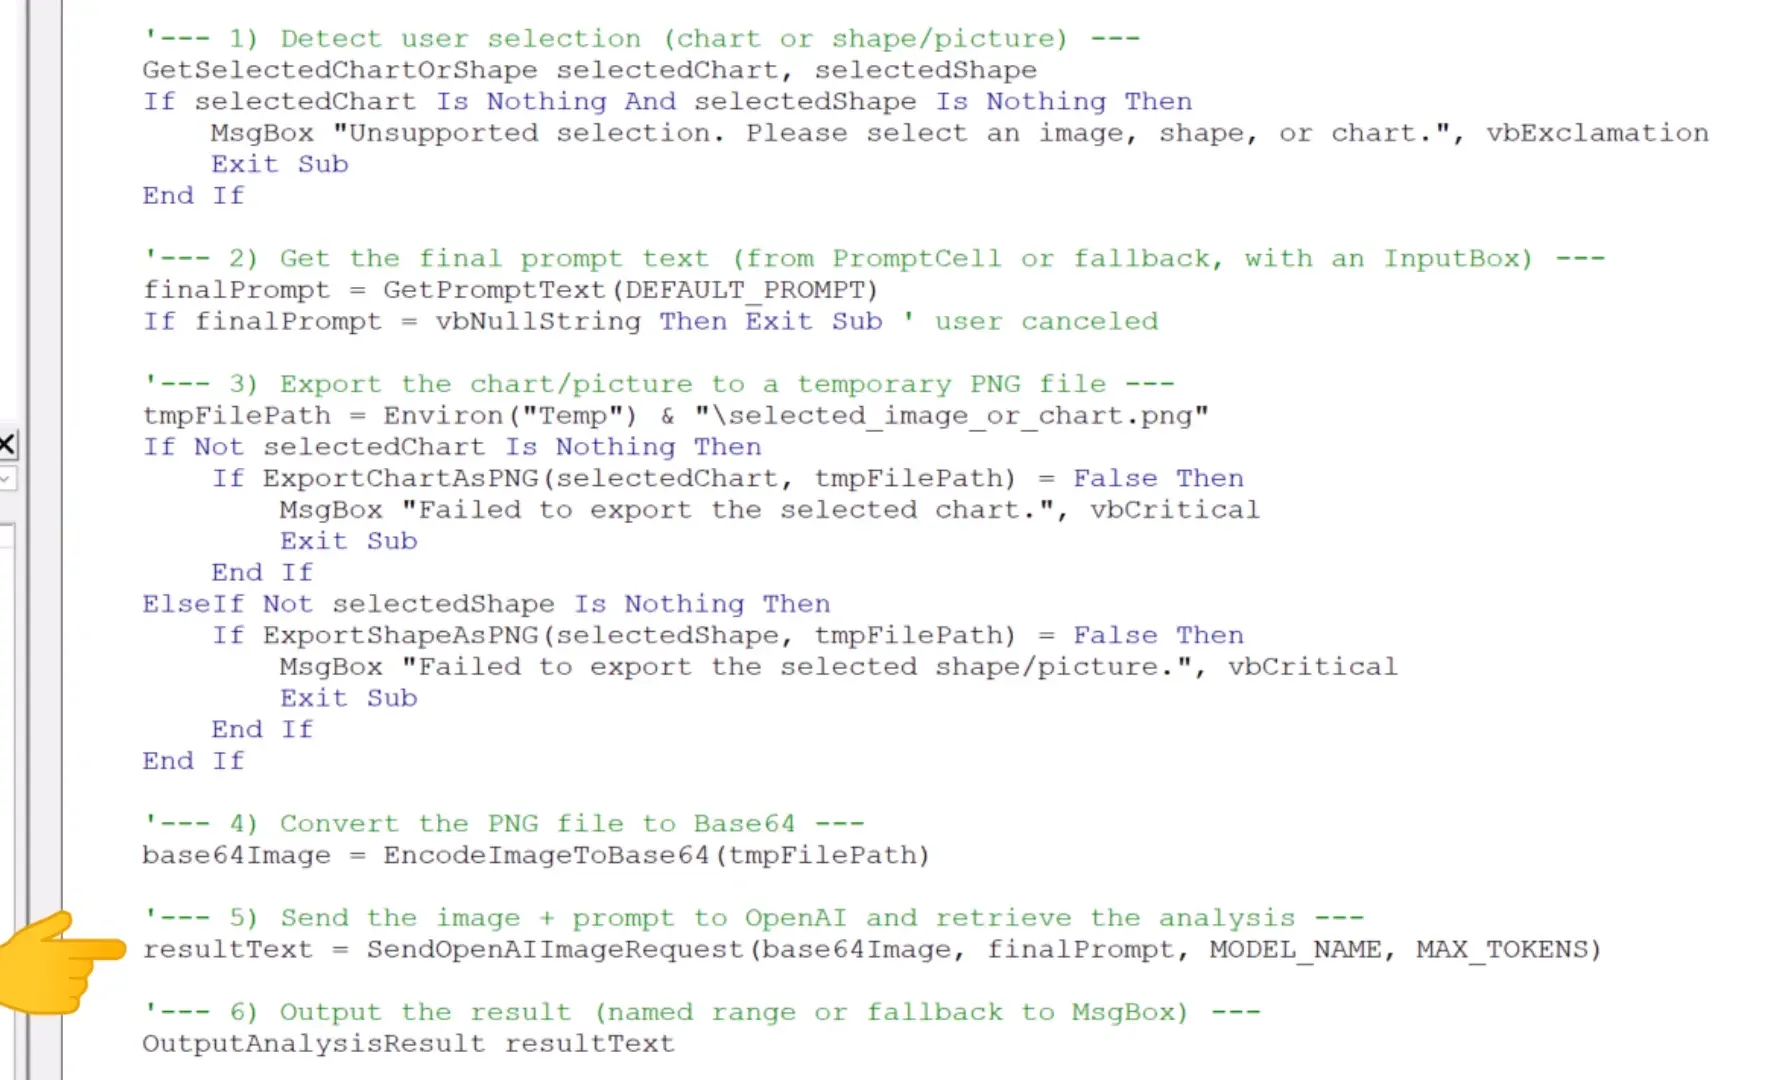
- Output Handling: The response from the API is either displayed in a message box or written into the output cell, depending on your setup preferences.
This walkthrough provides a clear understanding of how the code functions, enabling you to modify settings such as the model used, the default prompt, and maximum response tokens. By familiarizing yourself with this structure, you can tailor the analyzer to better suit your needs.
Conclusion
Incorporating AI into your Excel workflows can profoundly change how you analyze and interpret data. The AI chart and image analyzer we discussed allows for quick insights, saving you time and effort. By setting up your personal macro workbook, integrating various AI tools, and utilizing the features of the AI analyzer, you can streamline your data analysis process significantly. Thanks for reading.