Export Pandas DataFrames to new & existing Excel workbook

Introduction
In this post, I will show you how to export multiple dataframes to Excel. We will look at how to save the dataframes to a new workbook and how we can export the data to an existing Excel file.
Install dependencies
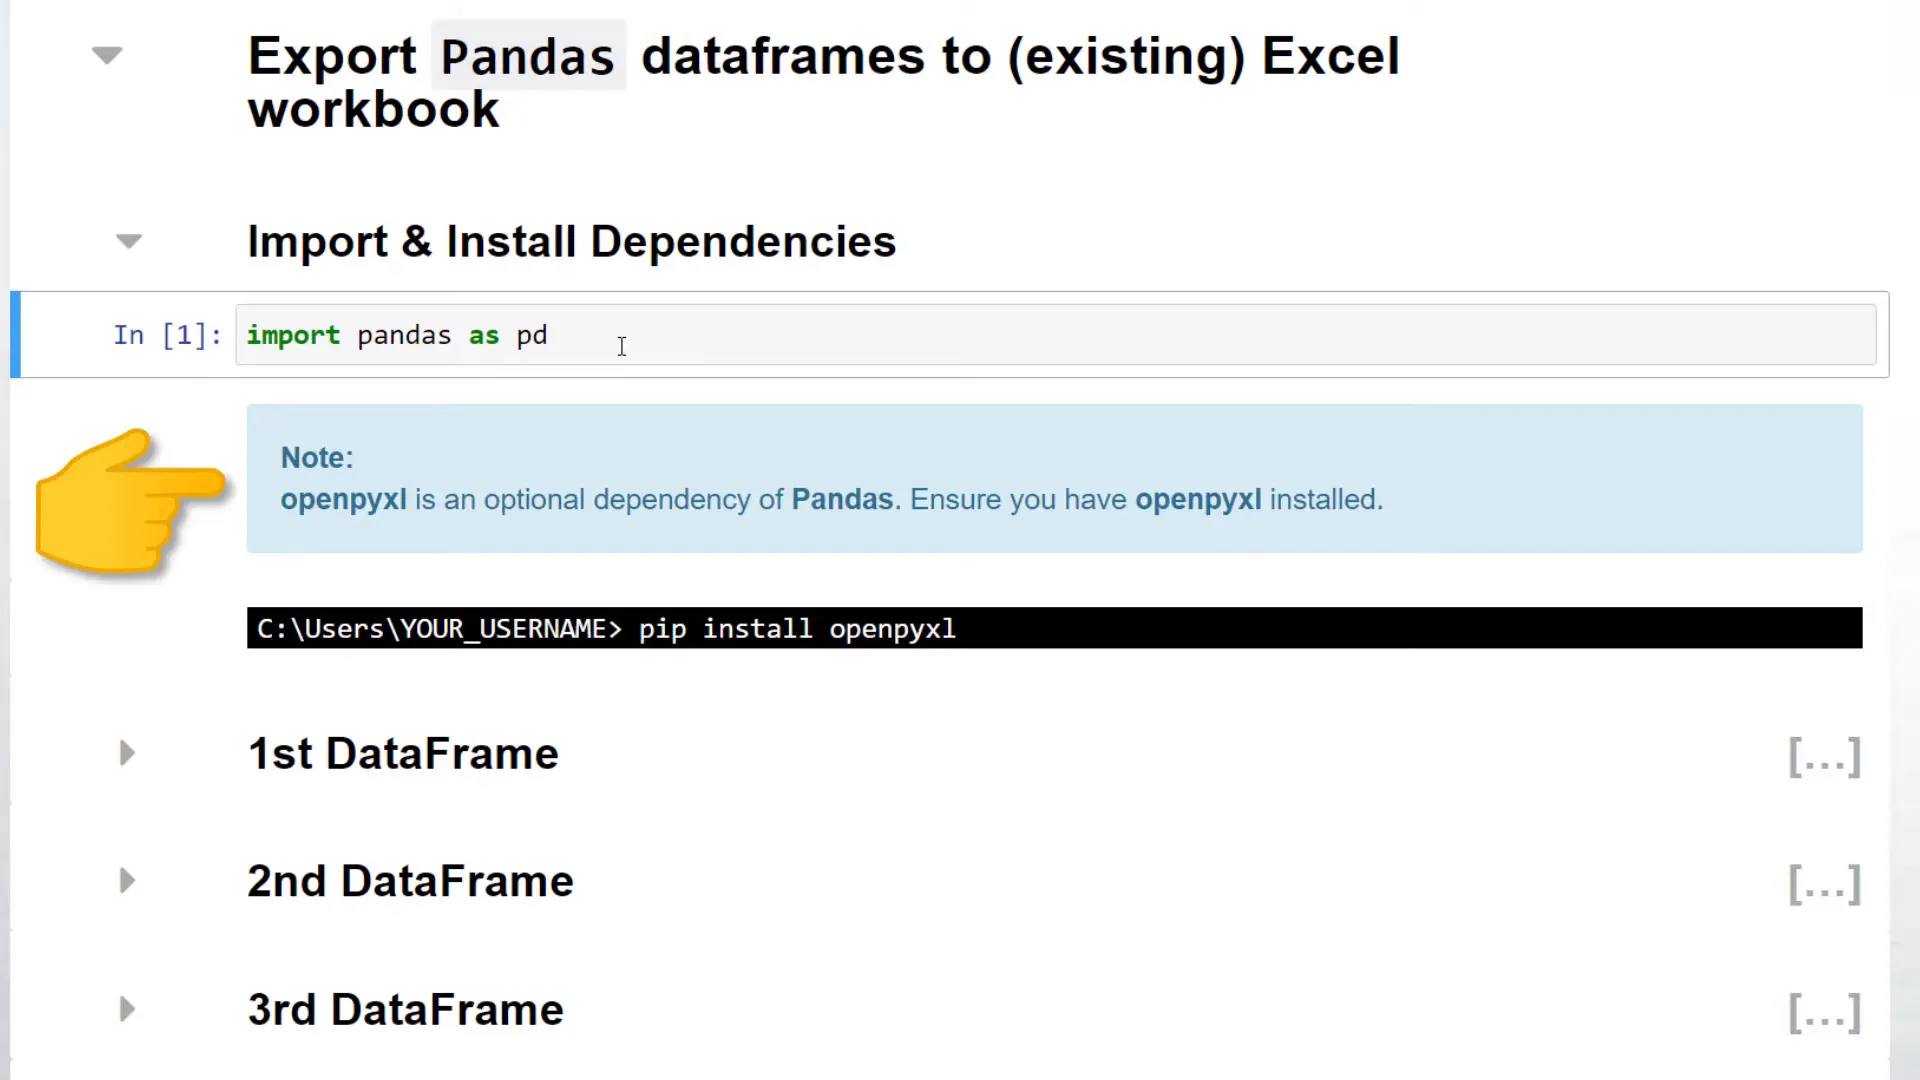
First things first, we need to install the required dependencies. I assume that you have pandas already installed. When dealing with Excel files, pandas uses openpyxl under the hood. You can install this module by typing pip install openpyxl in your command prompt or terminal.
Create new workbook
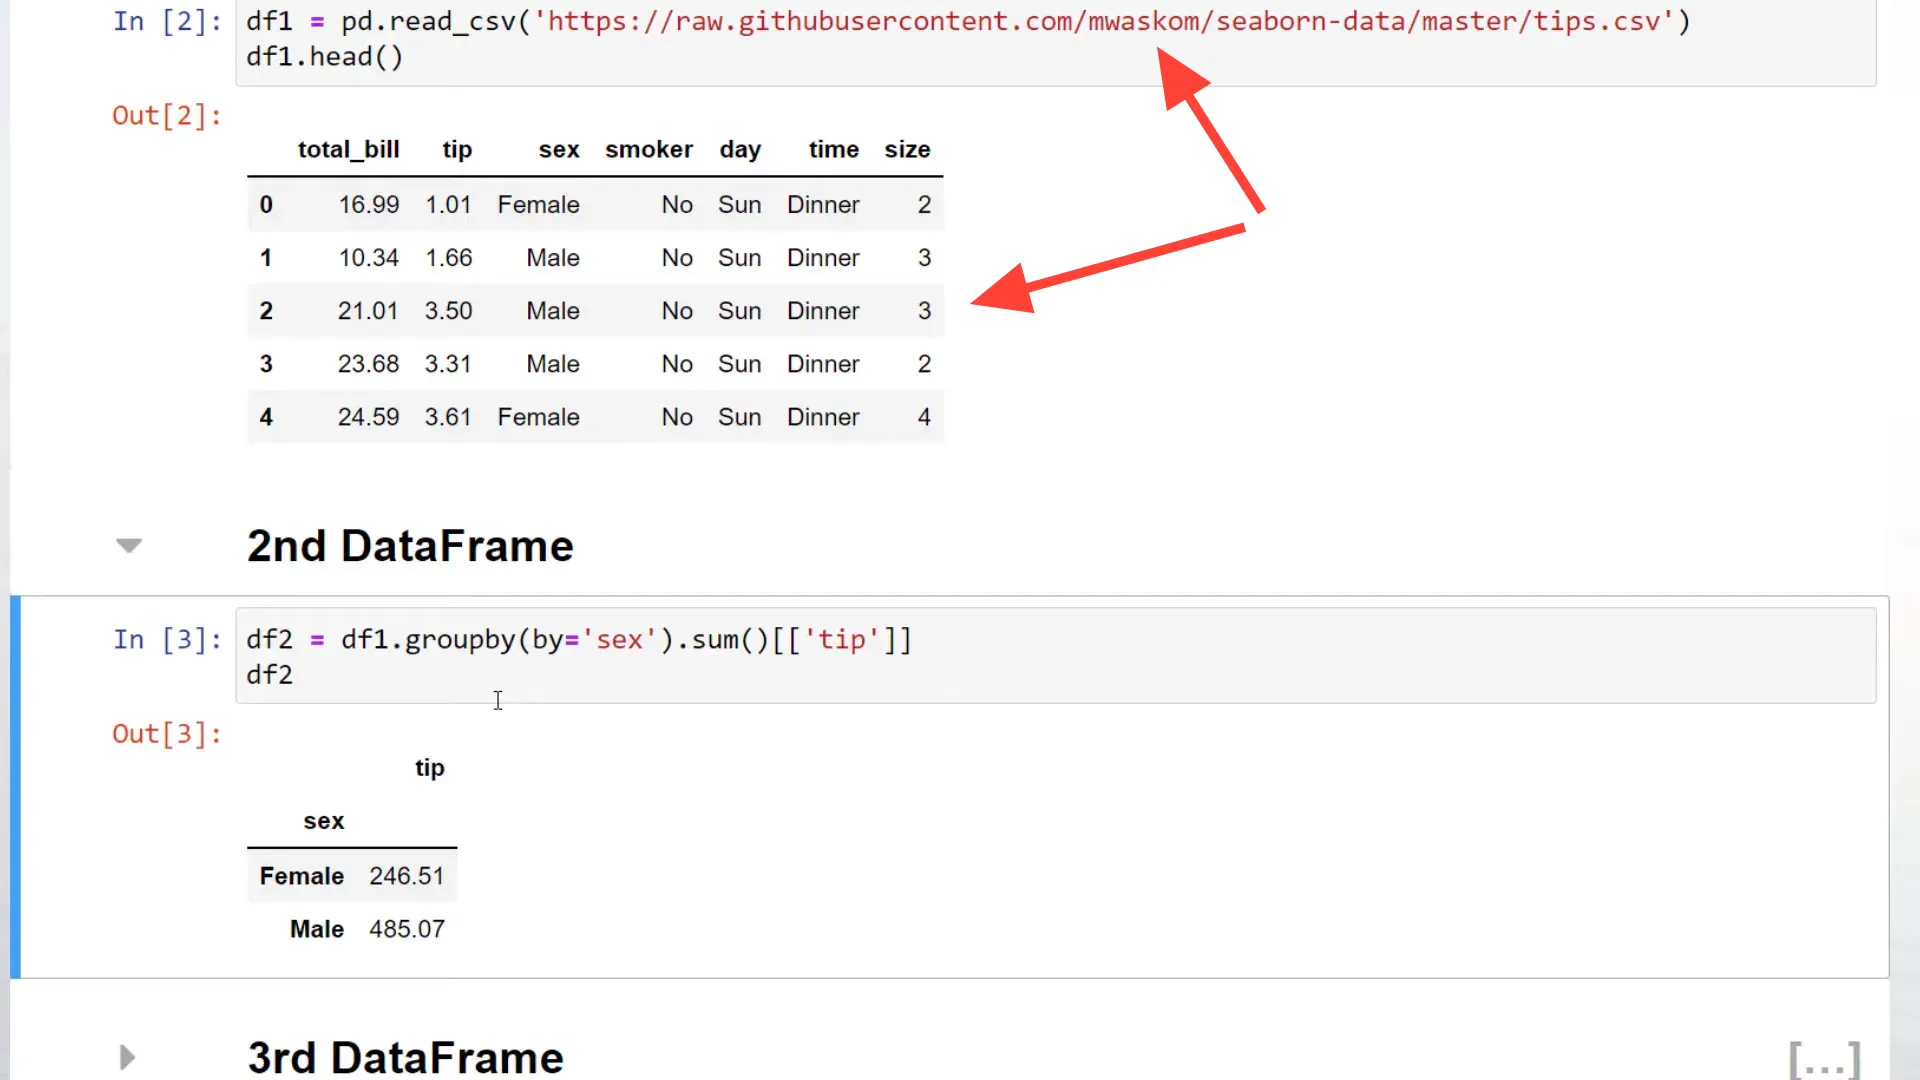
With that in place, I will create the first dataframe. For this, I will use the tips dataset from the seaborn library. For the other two dataframes, I will group the tips by gender and day.
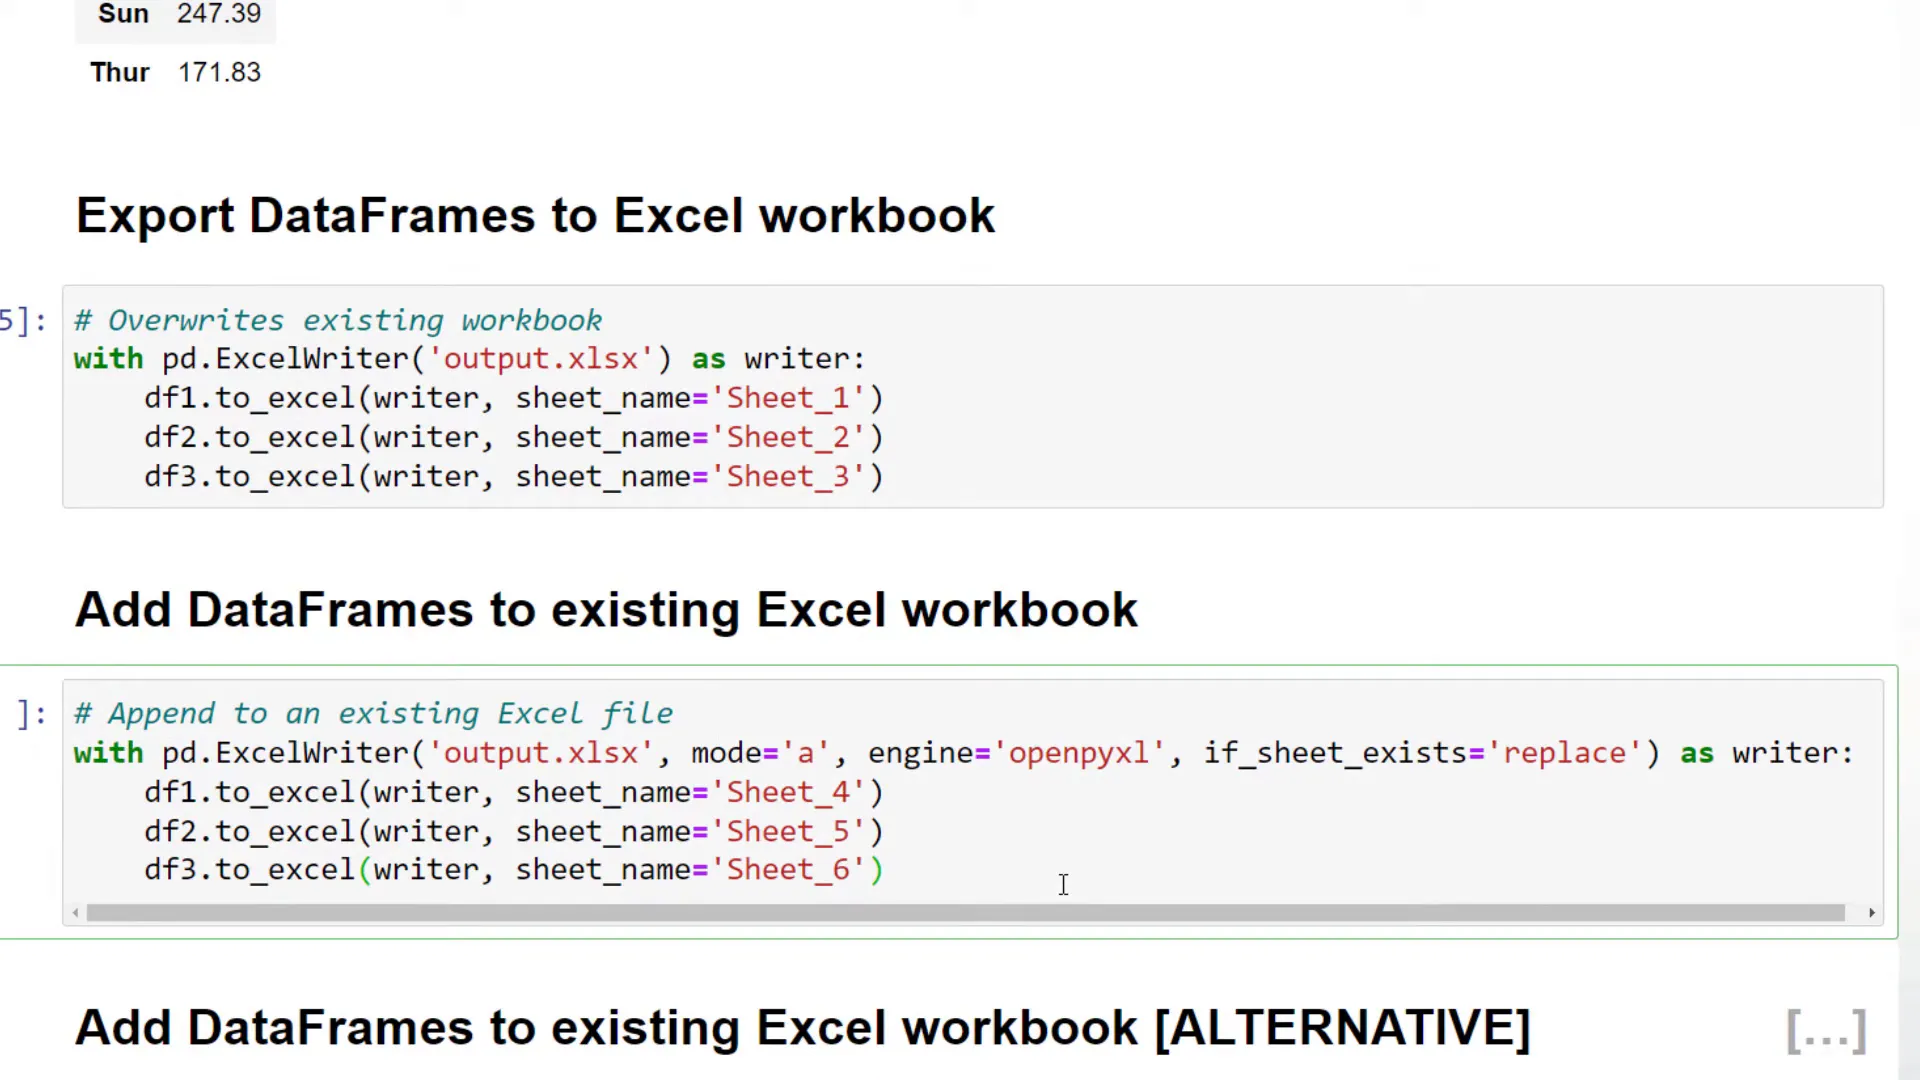
To export our dataframe to a new workbook, we could write the following. If this Excel file already exists, pandas will overwrite it. In my case, I would like to export the first dataframe to sheet 1, the second one to sheet 2, and the last dataframe to sheet 3.
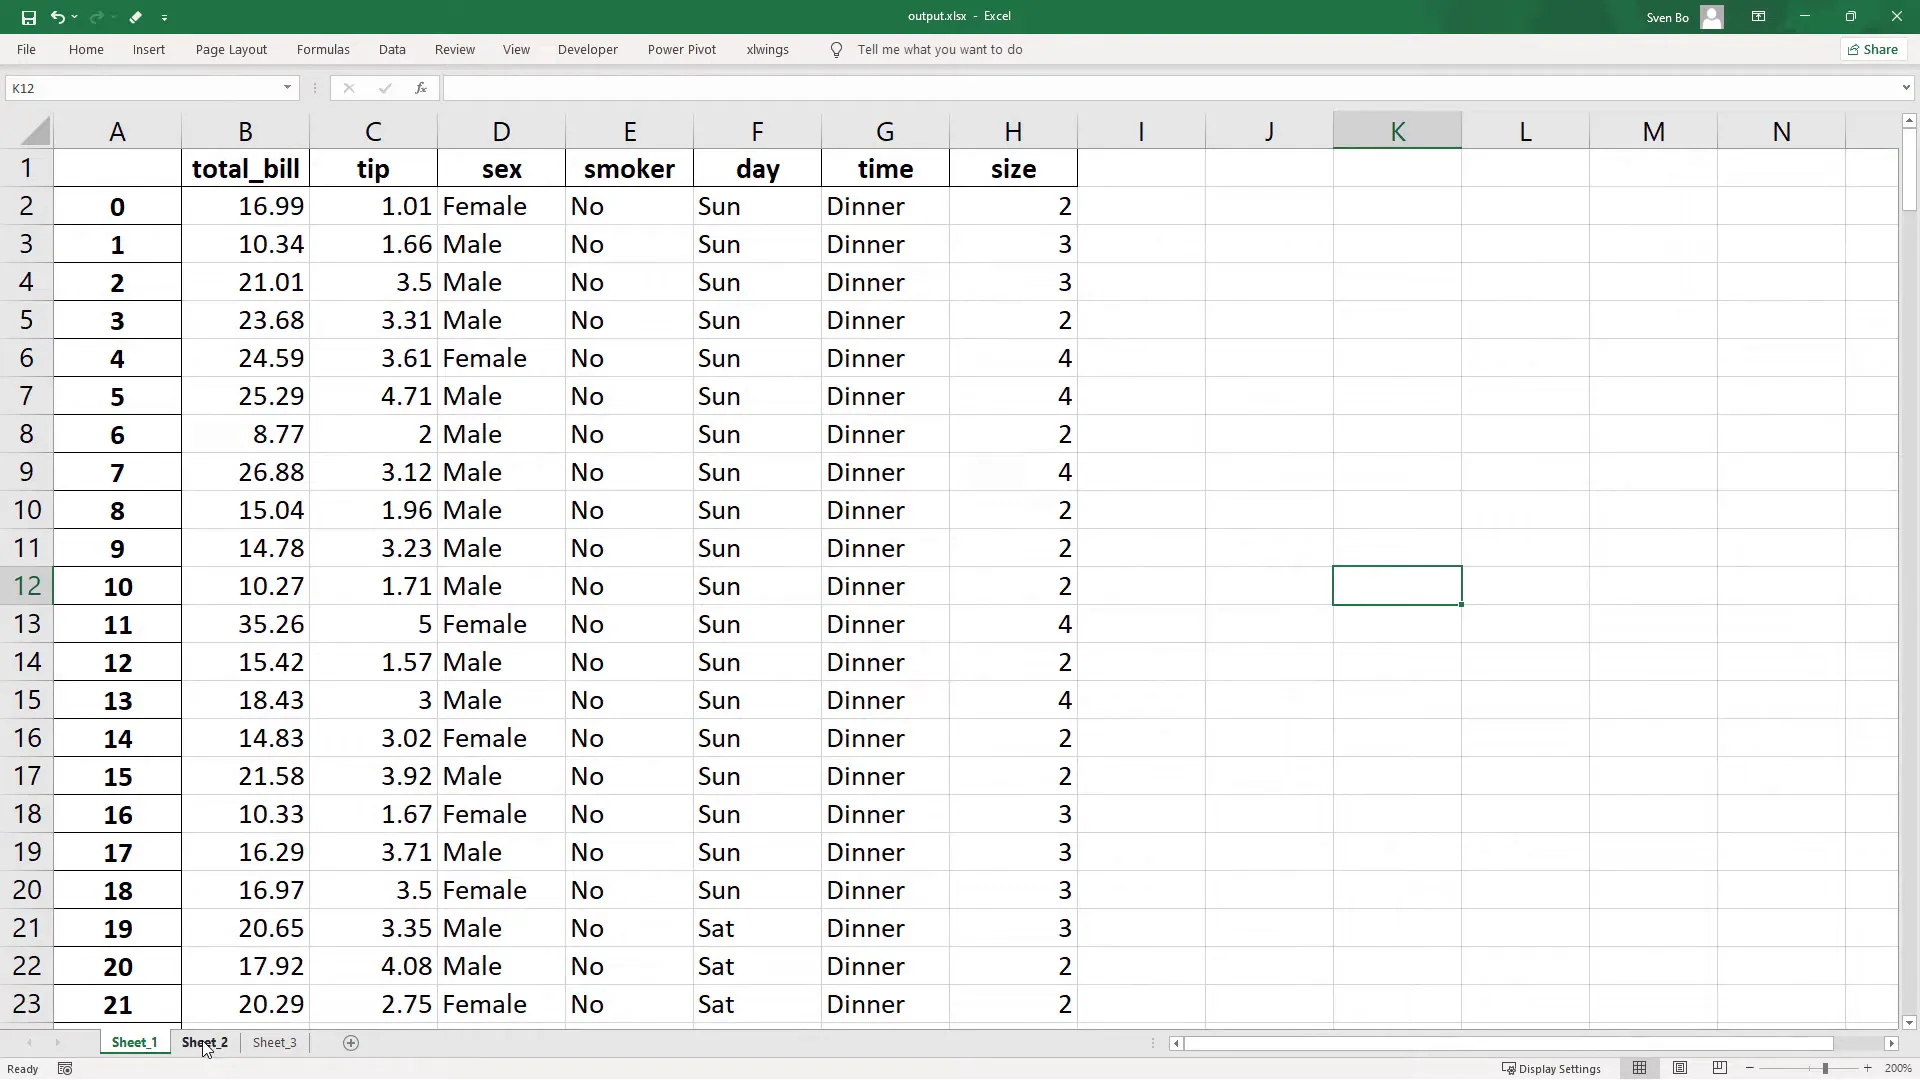
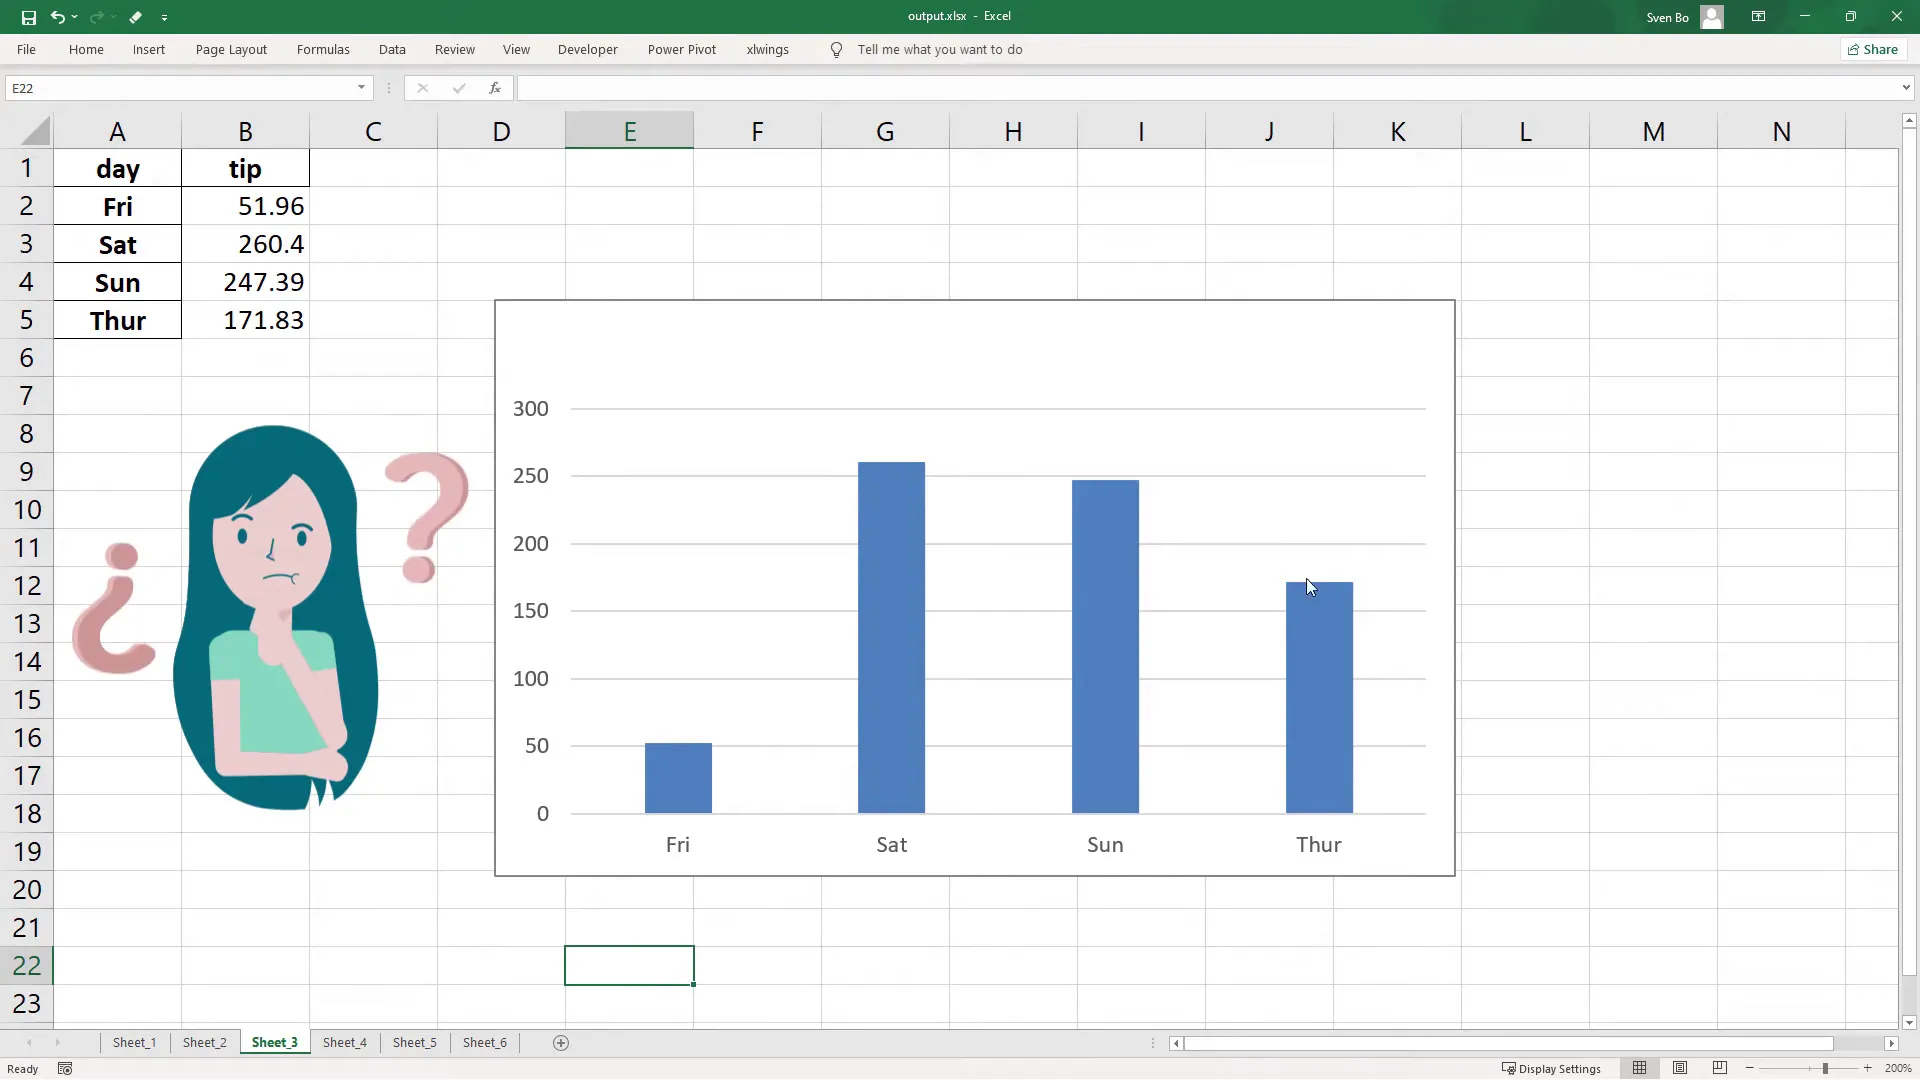
After running this cell, pandas has created the new Excel file. Within this workbook, we will see our different dataframes. I will make a simple bar chart within the third sheet with the title “tip”. In just a moment, you will see why I am doing this.
So, after inserting the chart, let me save this workbook and head back to our Jupyter notebook. We will now use this workbook for the following example, where we are going to append the dataframes to an existing Excel file.
Append dataframes to existing workbook
The code is very similar to before. The only difference is that I use 'a' for append in the argument 'mode'. Additionally, I have set the engine explicitly to openpyxl, and I would like to overwrite the worksheet if the sheet already exists.
With that in place, let me run this cell and open the Excel workbook. As expected, we will see our new worksheets as well as the old ones. But when I created this tutorial, I noticed some strange behavior. Let me go back to the chart we have inserted earlier.
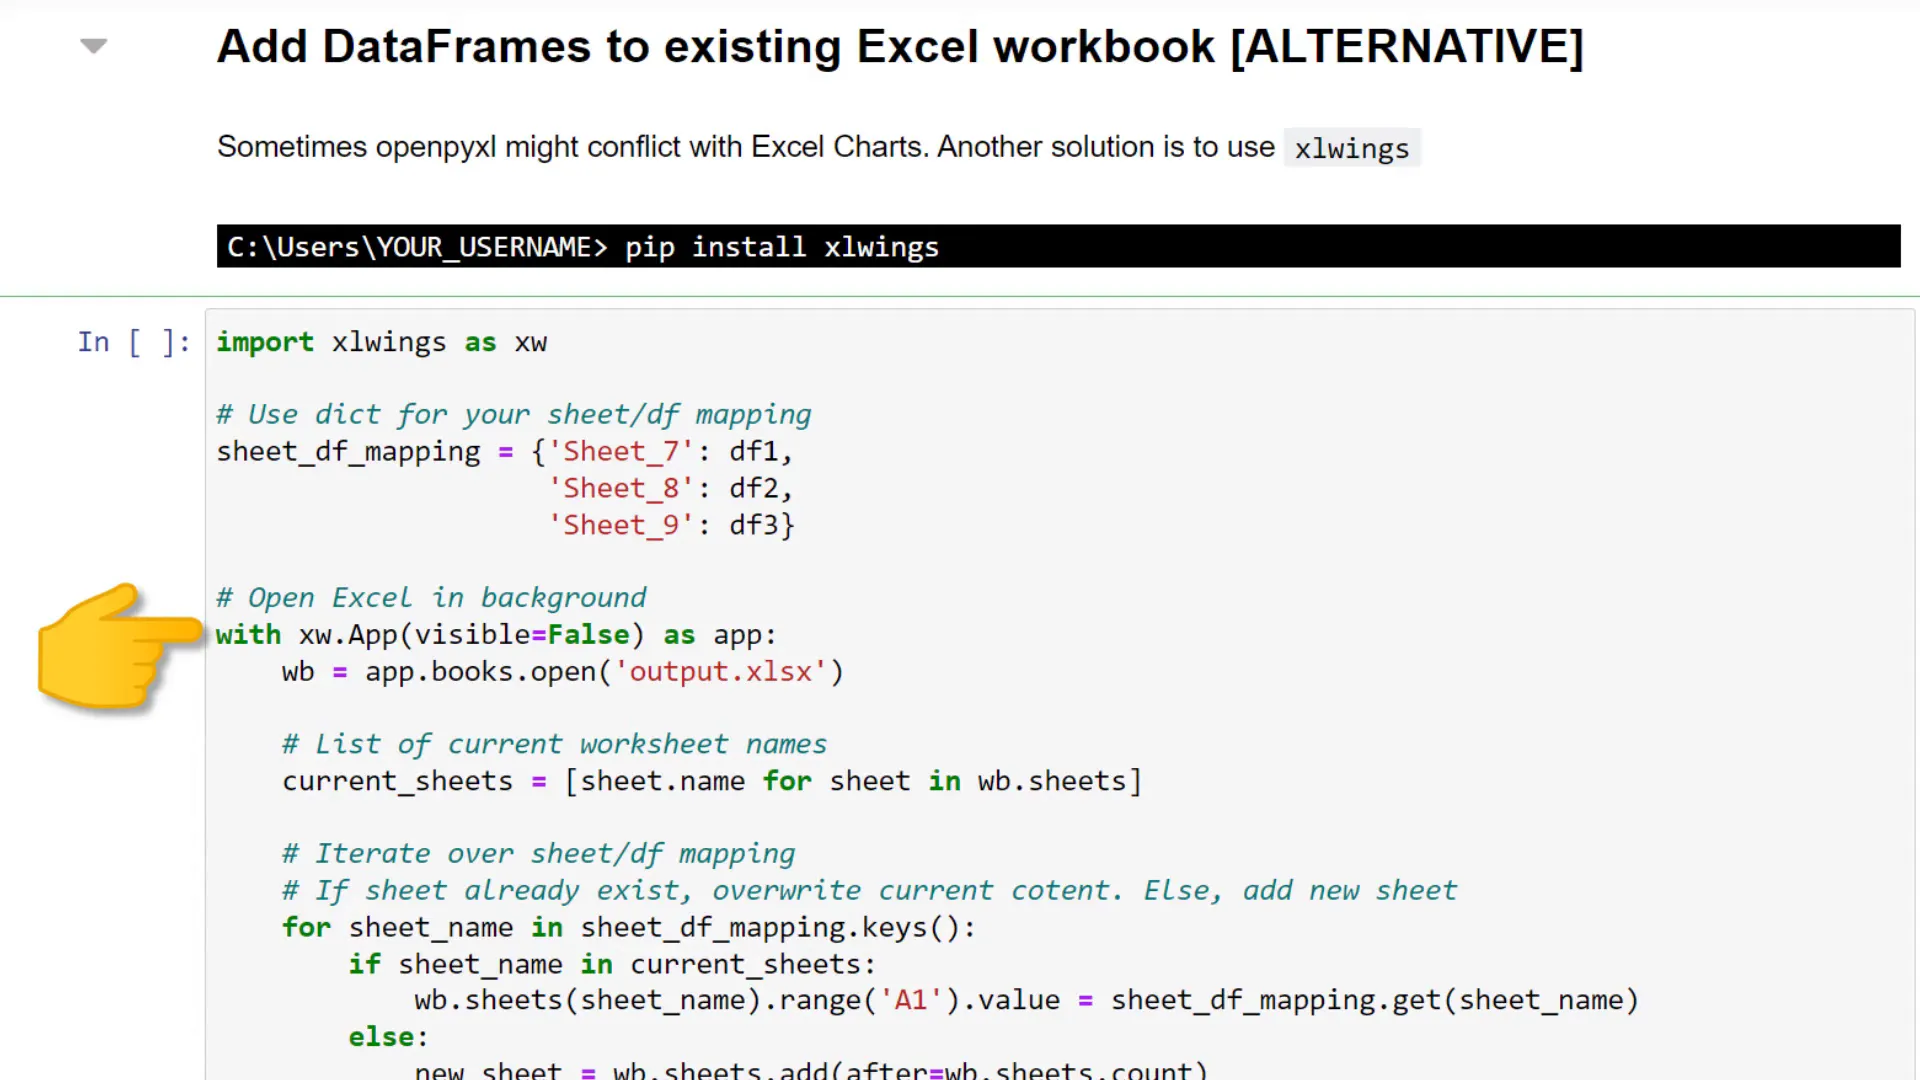
Do you see anything weird here? Well… suddenly, our chart title disappeared. And I could not really find a way to fix this within openpyxl. That is why I came up with an alternative solution.
So let me add back the chart title, save the workbook, and go back to my Jupyter notebook. Instead of openpyxl, I will be using the xlwings library. You can install the module by running pip install xlwings.
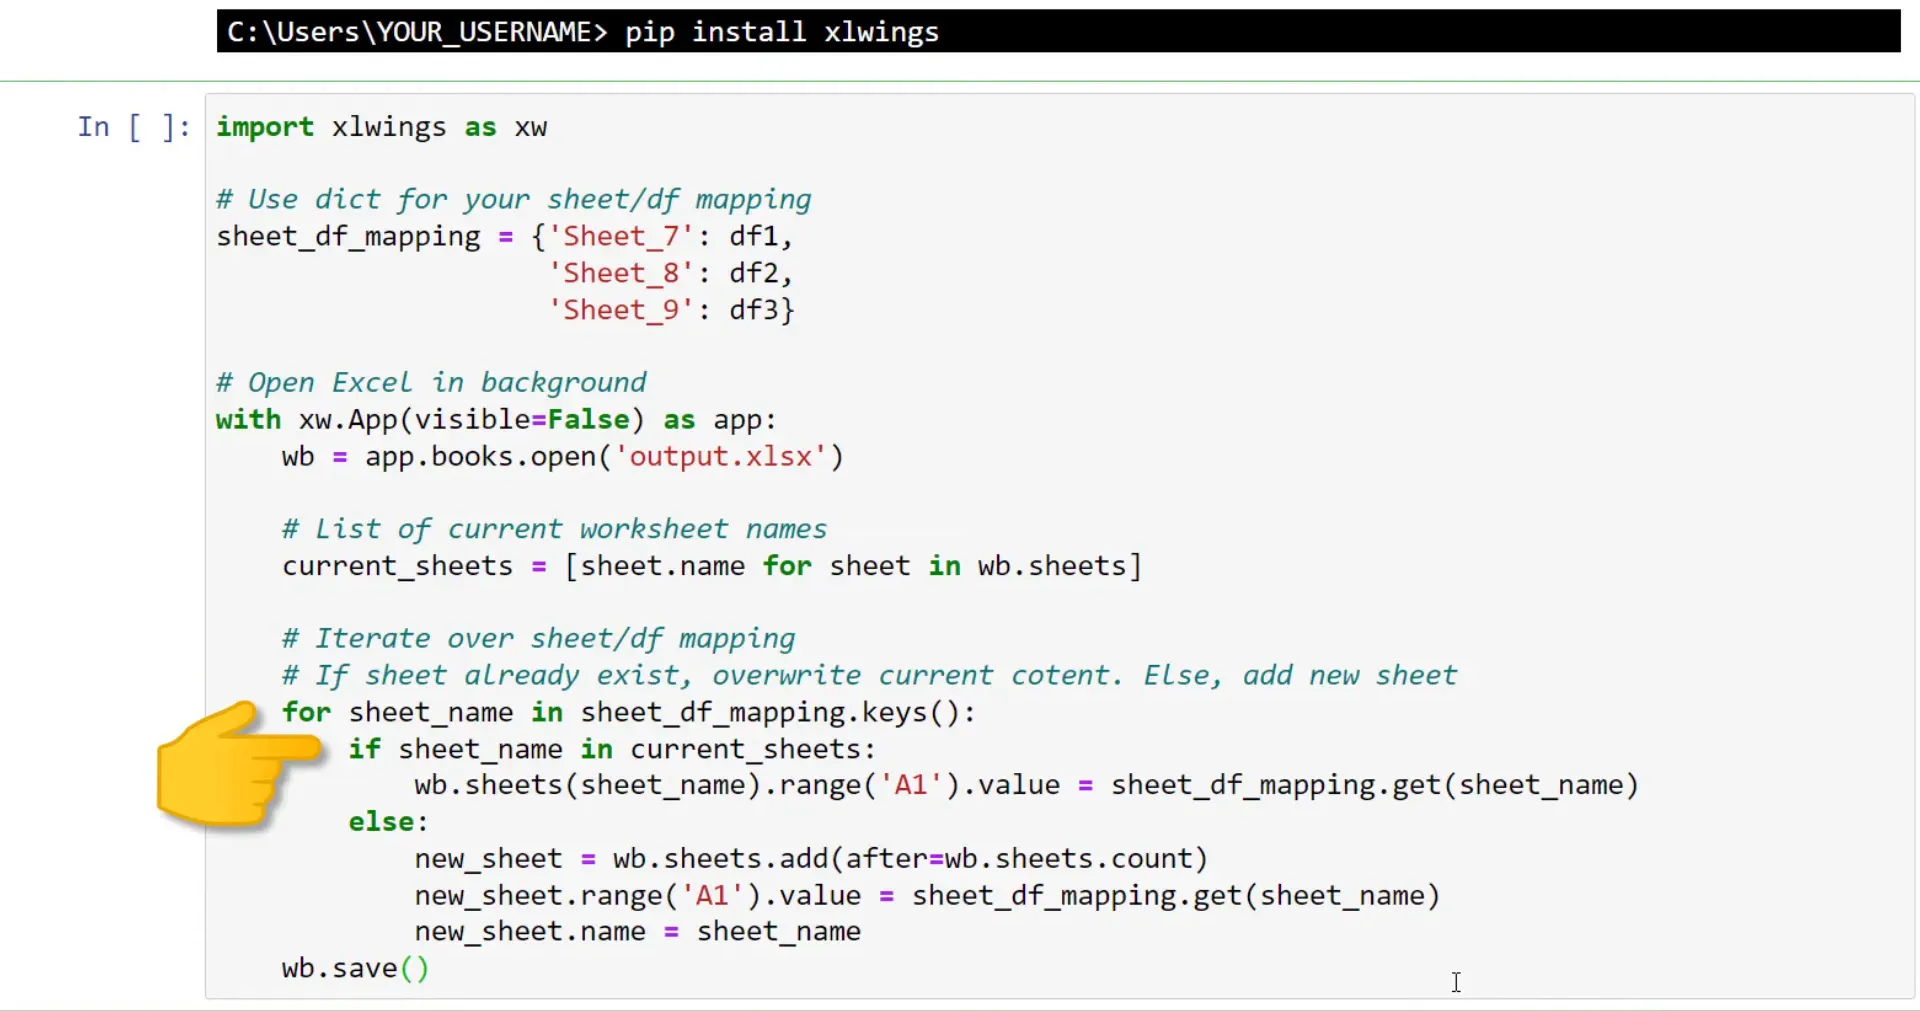
Once you have sorted this out, you can import xlwings as xw. Next, I am creating a Python dictionary as a mapping table. So, for example, xlwings should export the first dataframe to sheet 7.
With this mapping table in place, I will initialize the Excel instance. By setting visible to false, Excel will start in the background. Then, I am going to load our workbook.
Within this workbook, I am using a list comprehension to store the current sheet names in a list. As the next step, I will loop over the keys from our mapping table, so the sheet names. If the sheet name already exists, I will insert the respective dataframe to cell A1. Otherwise, I will add a new sheet to our workbook.
Within that sheet, I will also write the dataframe to cell A1 and rename the worksheet according to our mapping table. Once done, I can save the workbook.
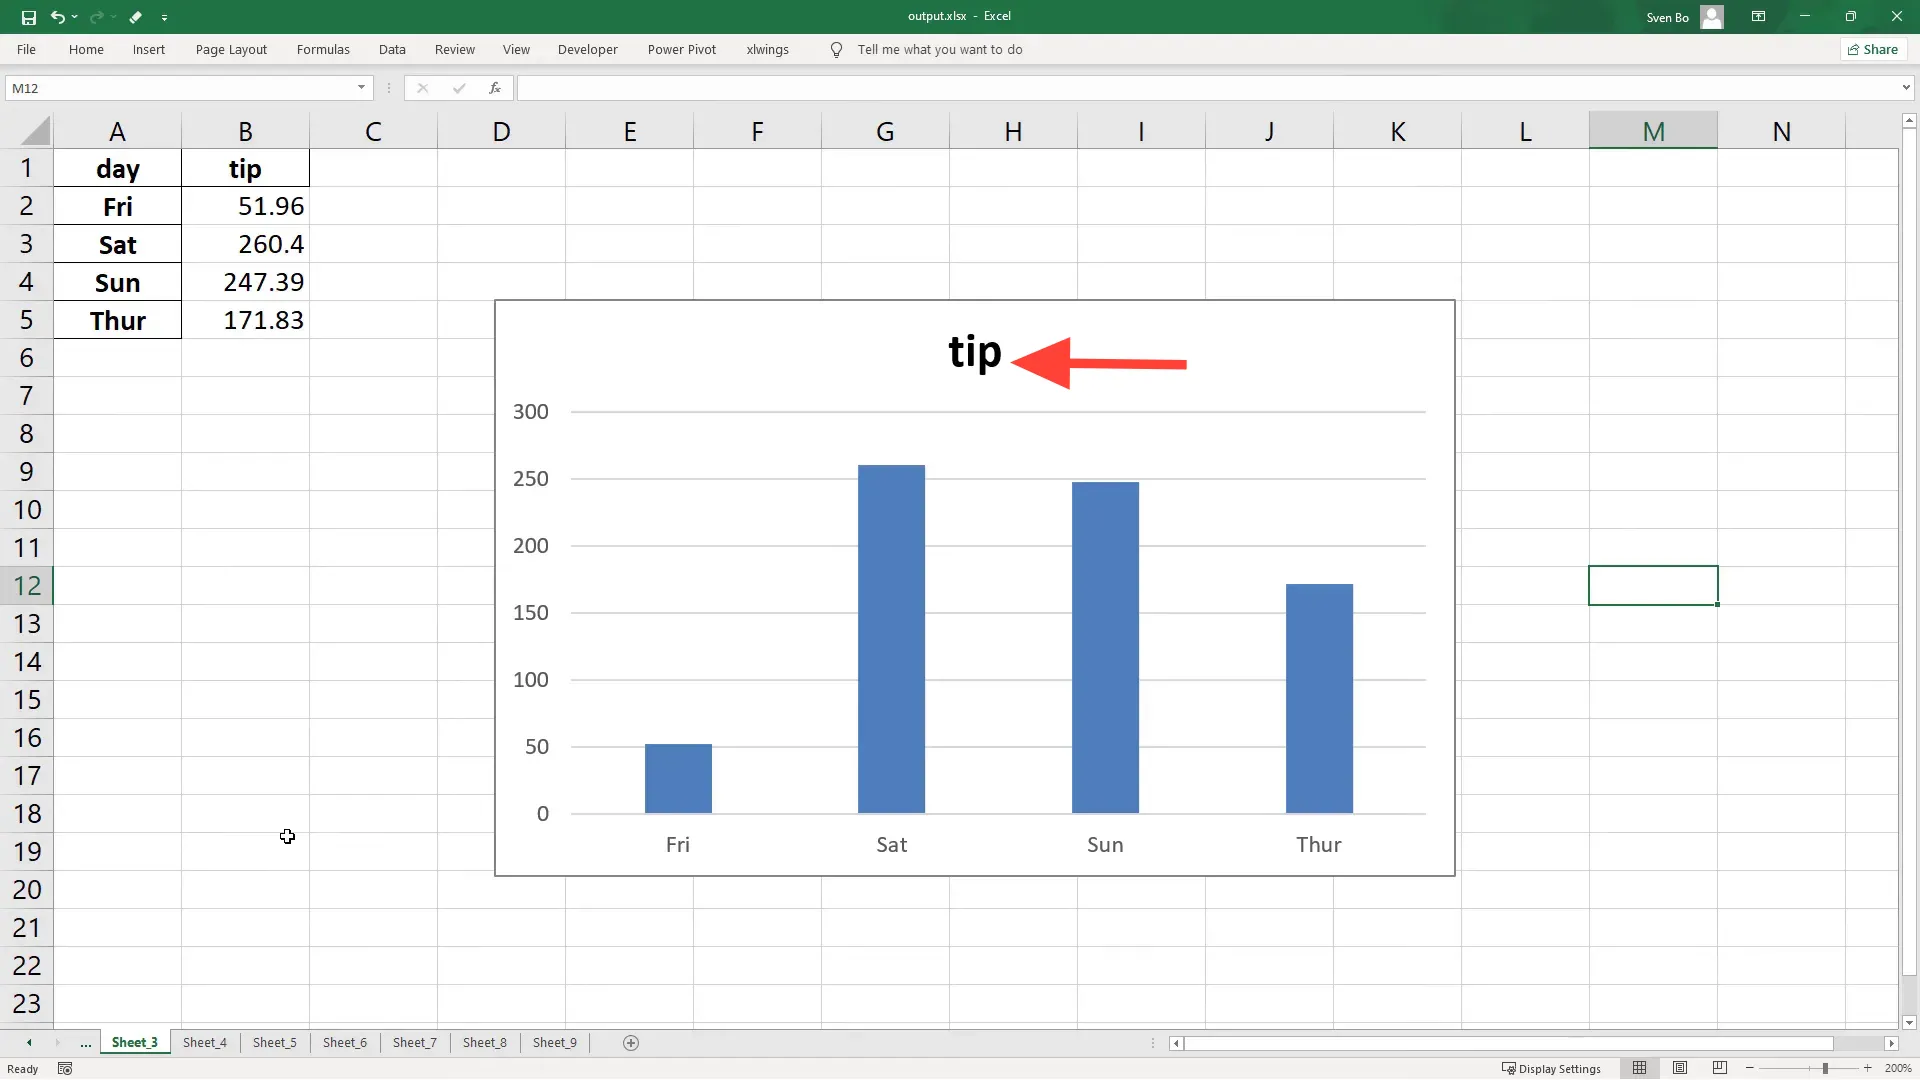
OK, and after executing this cell, let us recheck the workbook. As expected, we will see our new sheets. But xlwings was not messing around with our charts. We could validate that by checking the chart we have inserted earlier.
Conclusion
OK, here you have it – three different ways to export multiple dataframes to one Excel workbook. As always, if you have any questions, please let me know in the comments. Thanks for reading!