How to Get Stock Data & Export It To Excel Using Python
![How to Get Stock Data & Export It To Excel Using Python | Tutorial [EASY] 💻](https://pythonandvba.com/wp-content/cache/flying-press/1747fa1d019c4413acb58ae7ac411df7.jpg)
Introduction
In this guide, I will walk you through the process of retrieving stock information using Python and exporting it to Excel. This includes essential data such as adjusted close price, closing price, high, low, opening price, and traded volume by day. Even if you’re new to Python, you’ll find this tutorial easy to follow.
The only requirement is that you have Python installed on your machine. If you haven’t installed Python yet, there are plenty of tutorials available online to help you get started in just a few minutes.
Installing Required Libraries
Let’s get started by installing the libraries needed for this project. Press Windows + R to open the run dialog, then type cmd to open the command prompt.
If you downloaded the project folder from the description, you’ll also find a text file with the required libraries to install. You can install them by typing:
- pip install pandas
- pip install xlrd
- pip install pandas-datareader
- pip install datetime
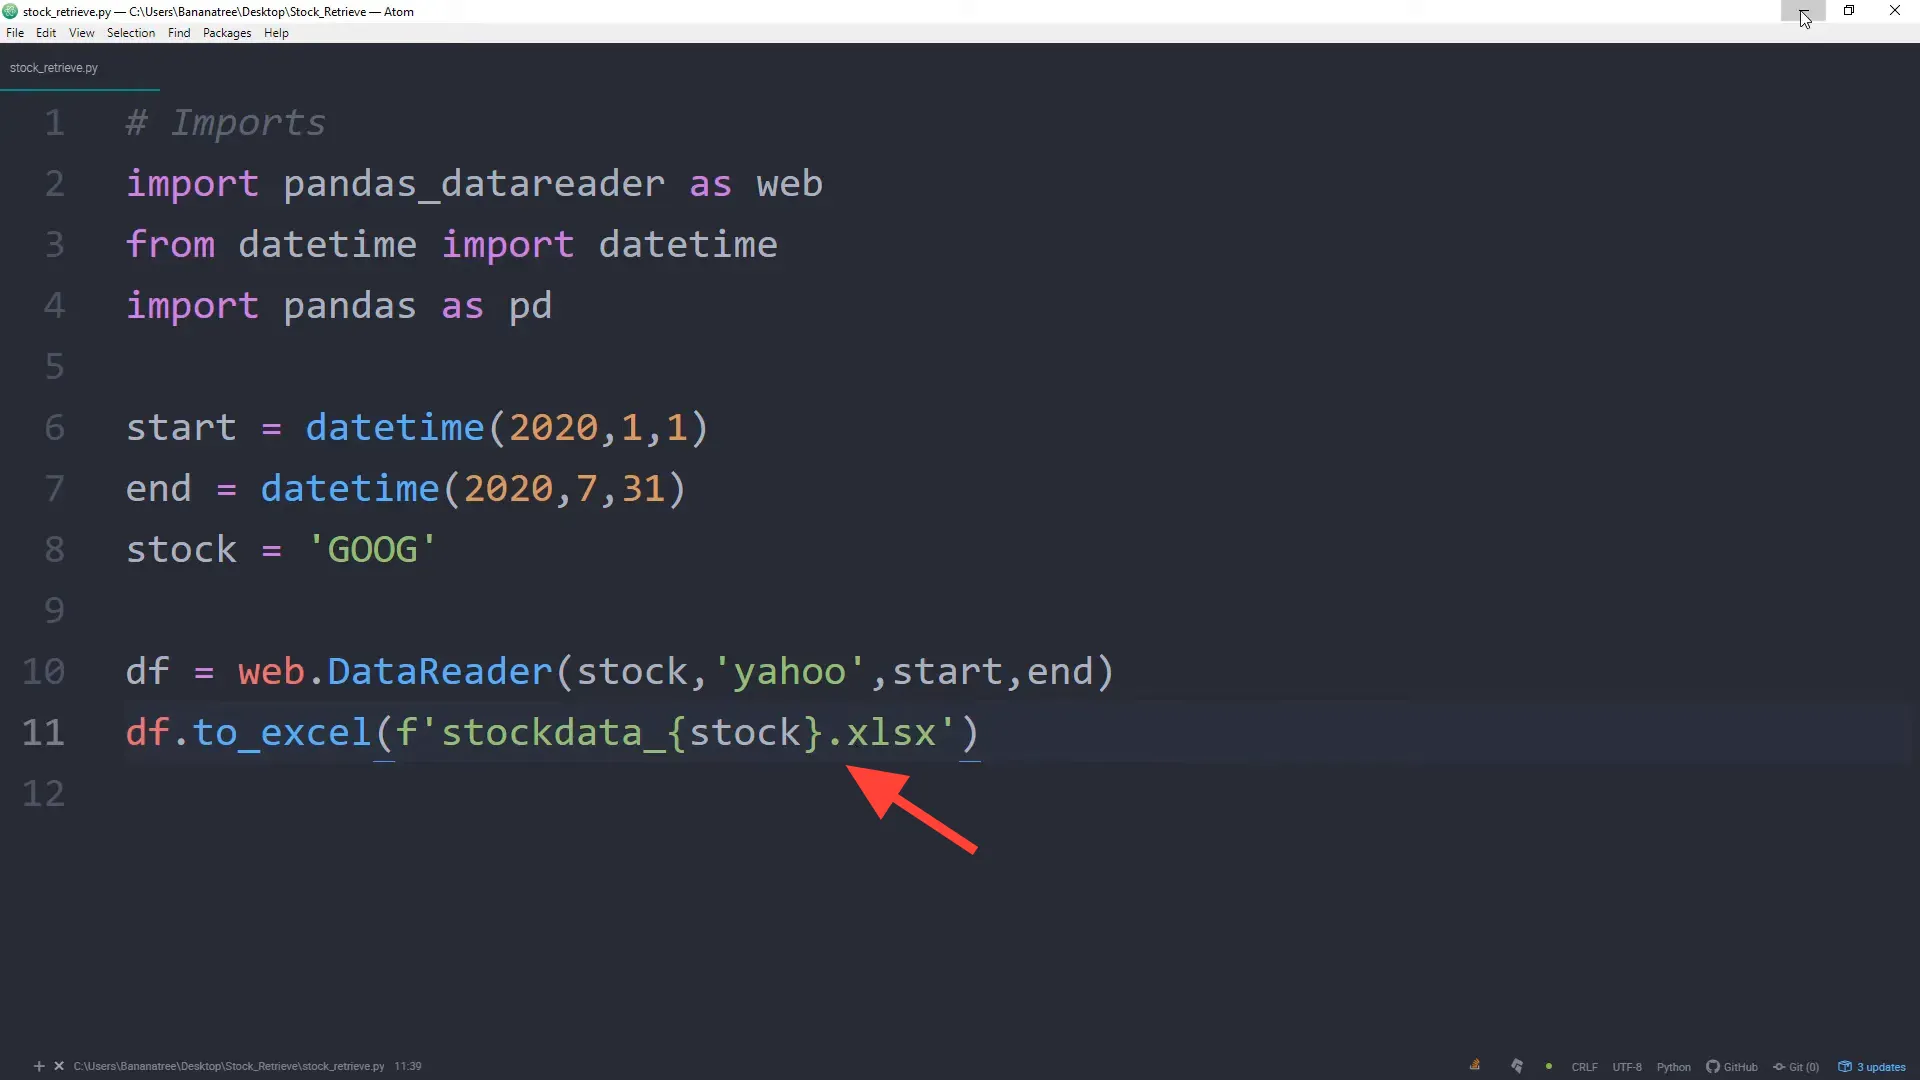
After installing these libraries, create a new Python file named stock_retrieve.py. In this file, import the libraries you just installed:
import pandas_datareader as web
from datetime import datetime
import pandas as pd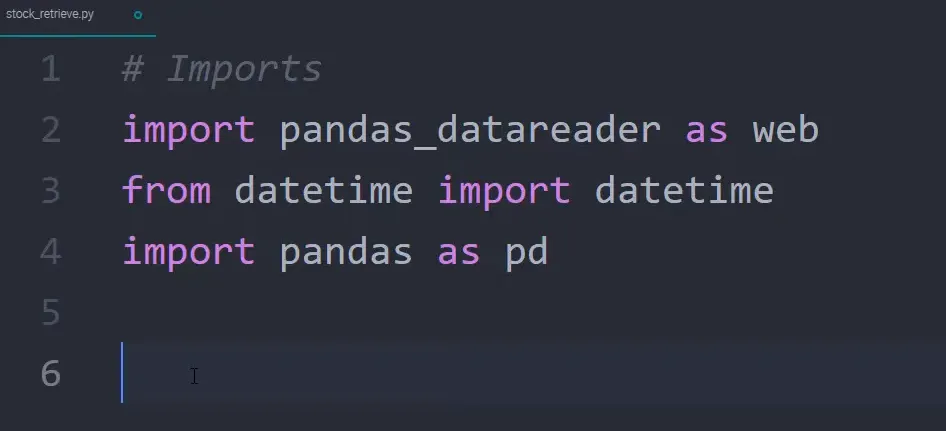
Setting Up Date Ranges
Next, specify the start and end dates for which you want to retrieve stock information. For example, to set the start date to January 1, 2020, use:
start = datetime(2020, 1, 1)And for the end date, you can set it to July 31, 2020:
end = datetime(2020, 7, 31)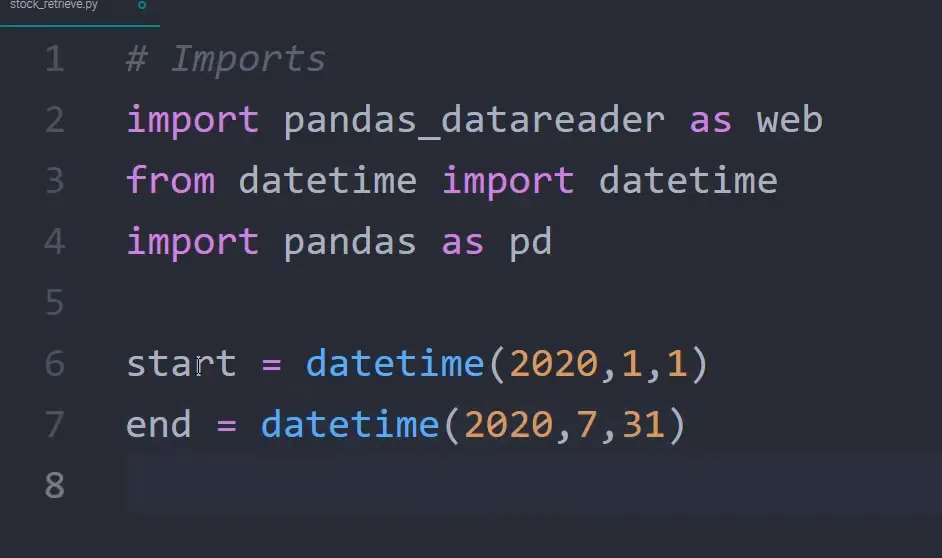
Choosing the Ticker Symbol
Now, specify the ticker symbol for the stock you want to retrieve. For example, for Alphabet Inc. (Google), set:
stock = 'GOOG'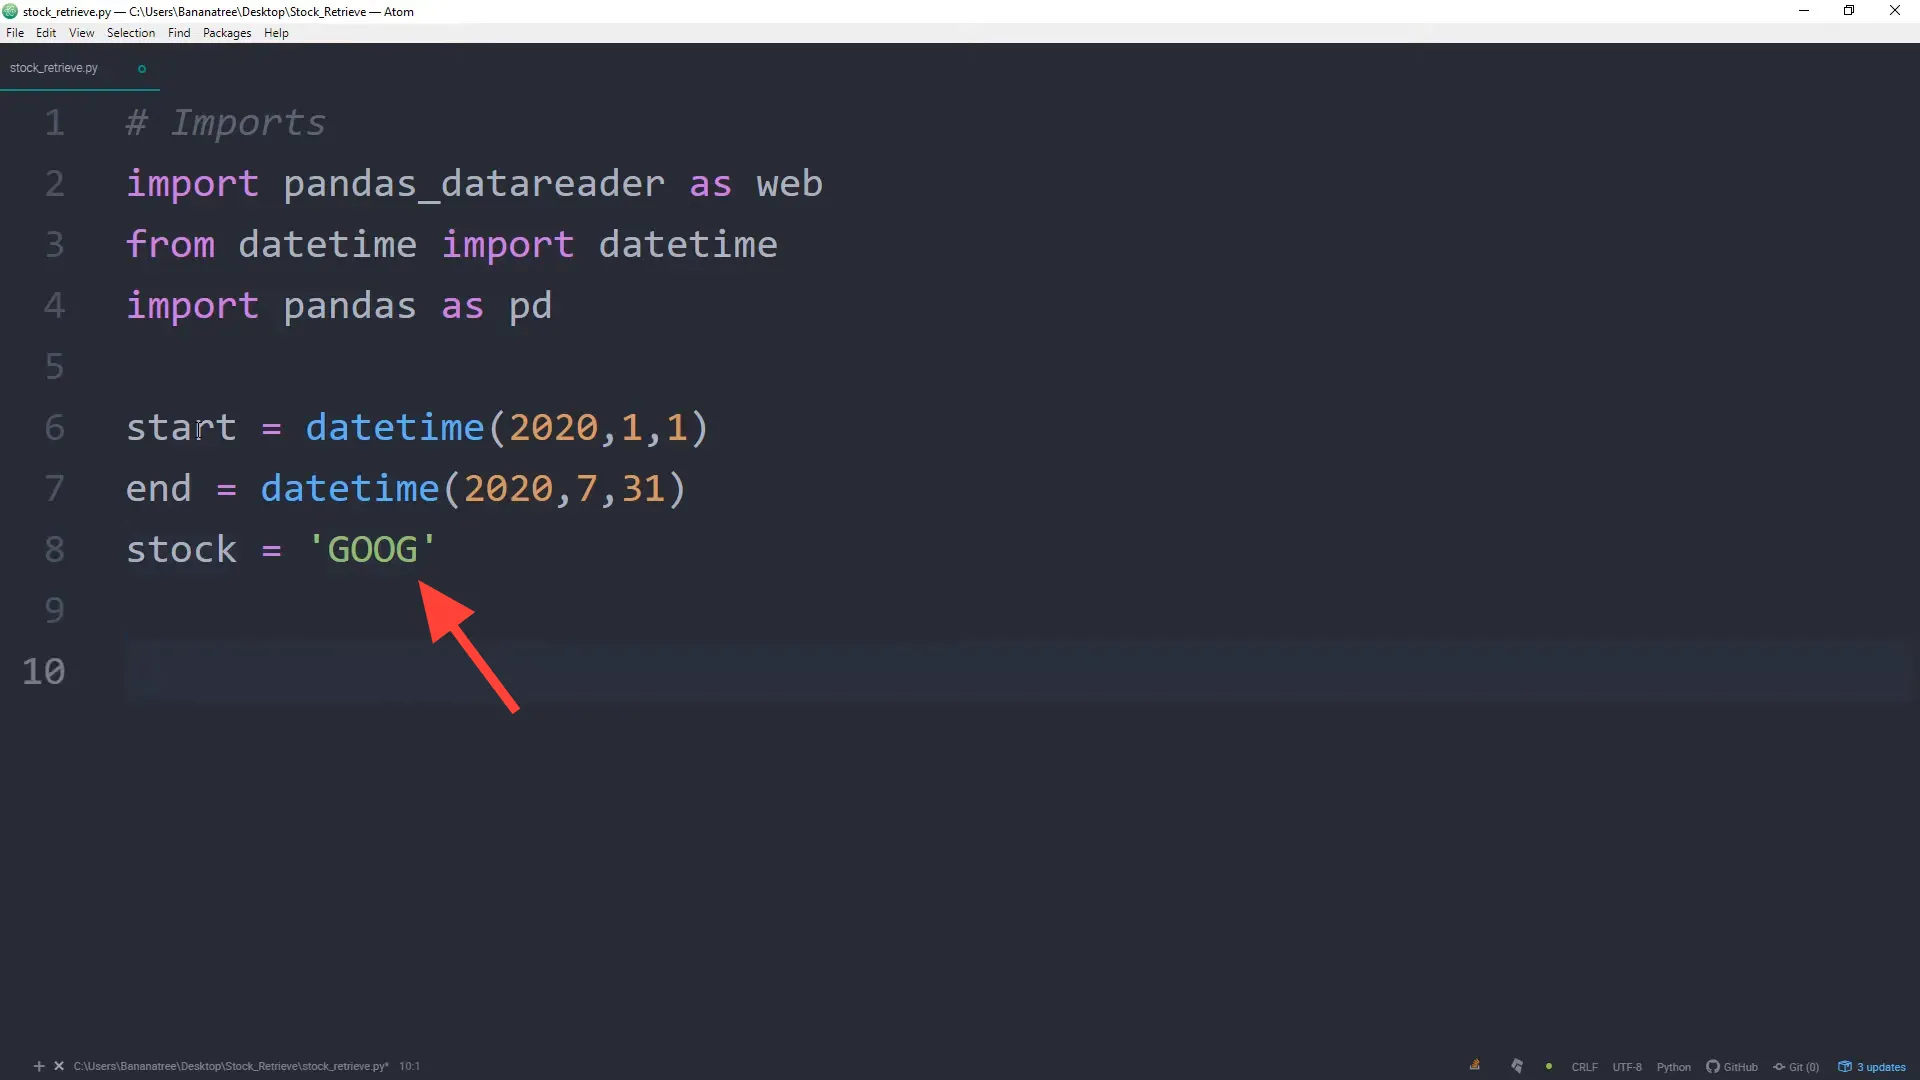
Retrieving Stock Information
Now it’s time to use the pandas data reader to retrieve the stock information. Here’s how you do it:
df = web.DataReader(stock, 'yahoo', start, end)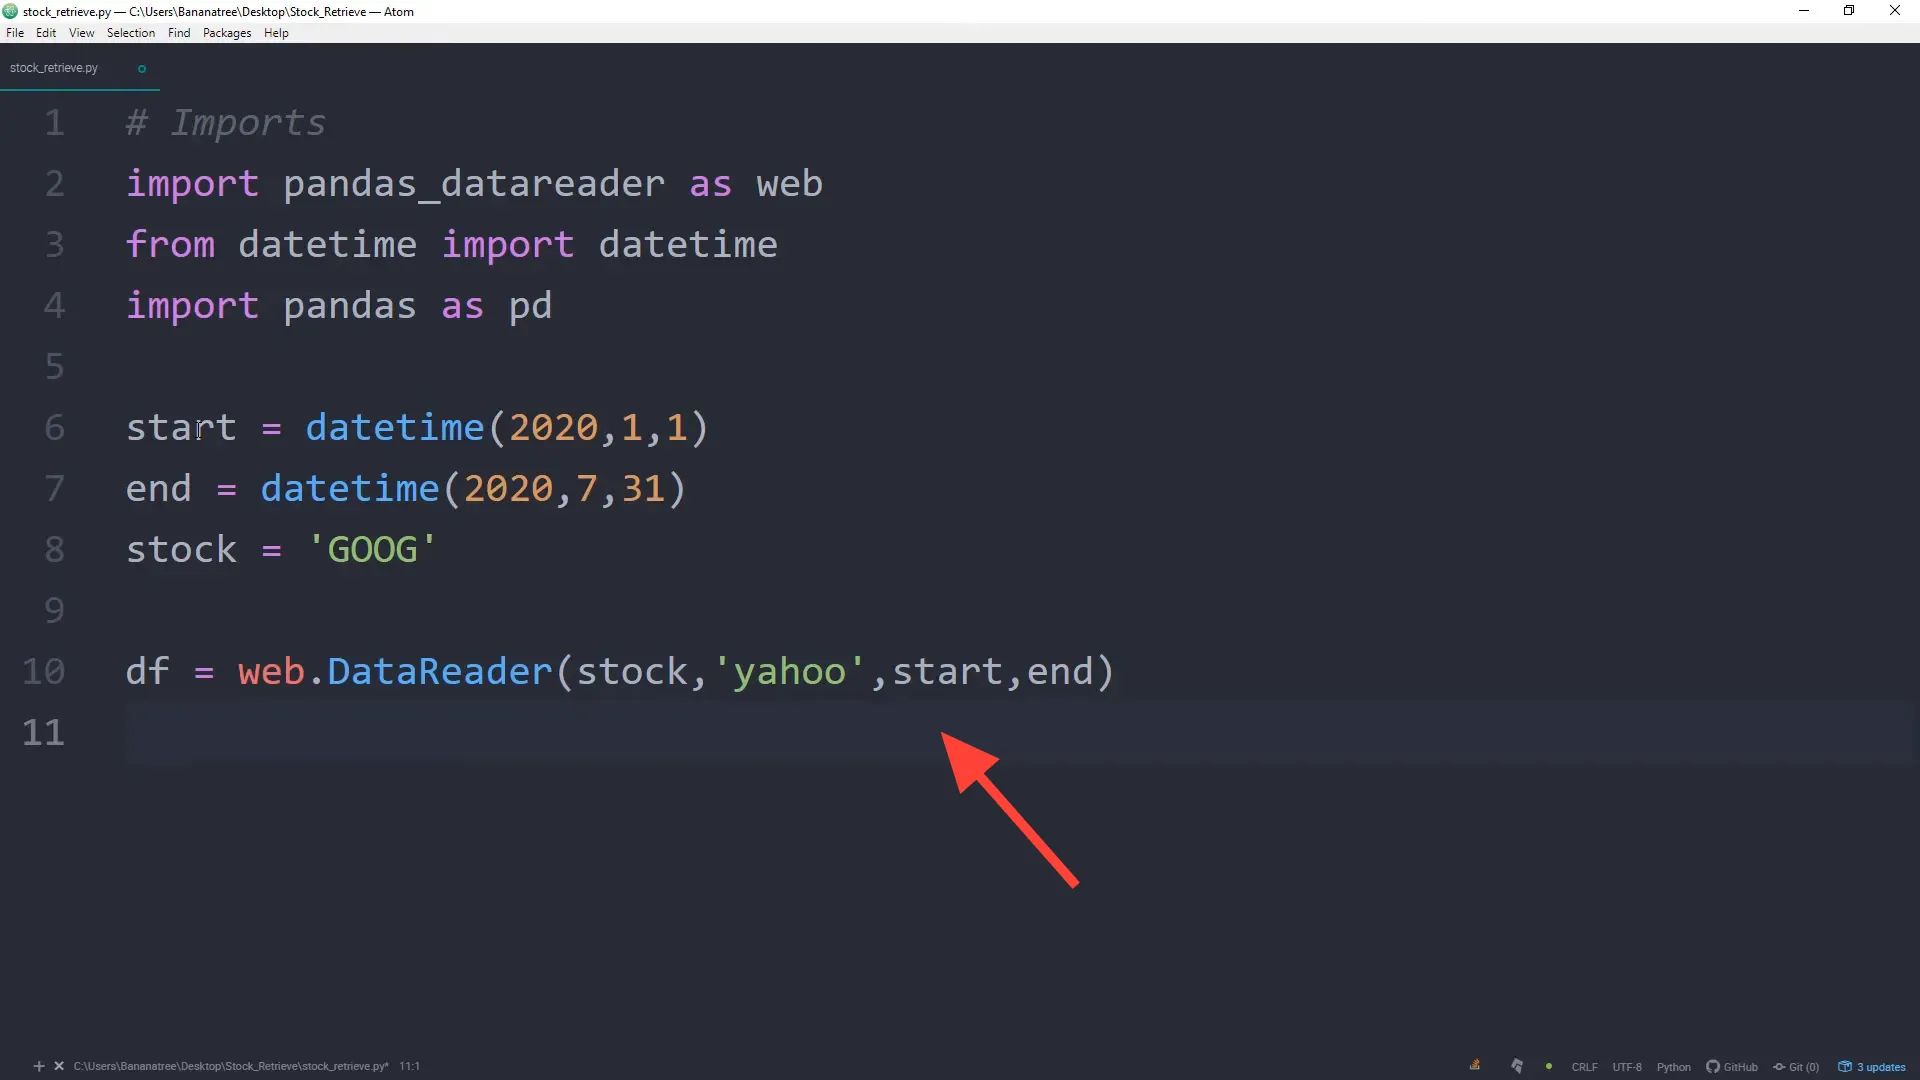
Exporting to Excel
After retrieving the data, you can export it to an Excel file using:
df.to_excel(f'stock_data_{stock}.xlsx')This command saves the data in an Excel file named stock_data_GOOG.xlsx.
Running the Script
To execute the script, navigate to the file location in the command prompt. Use the cd command followed by the path to the folder where your script is stored. For example:
cd Desktop/stock_retrieveThen, run the script by typing:
python stock_retrieve.py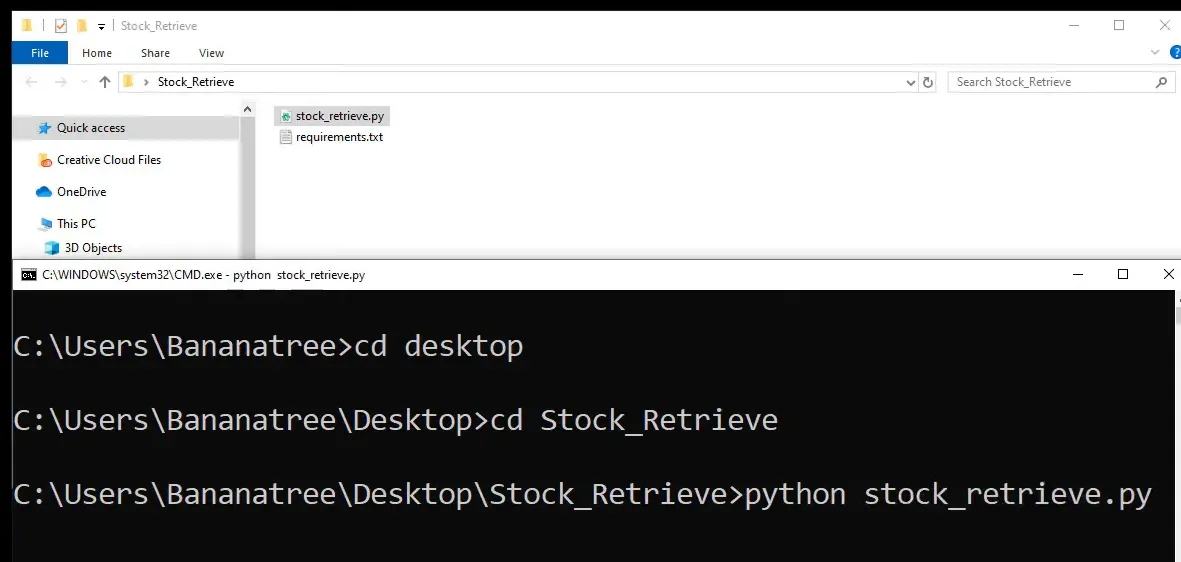
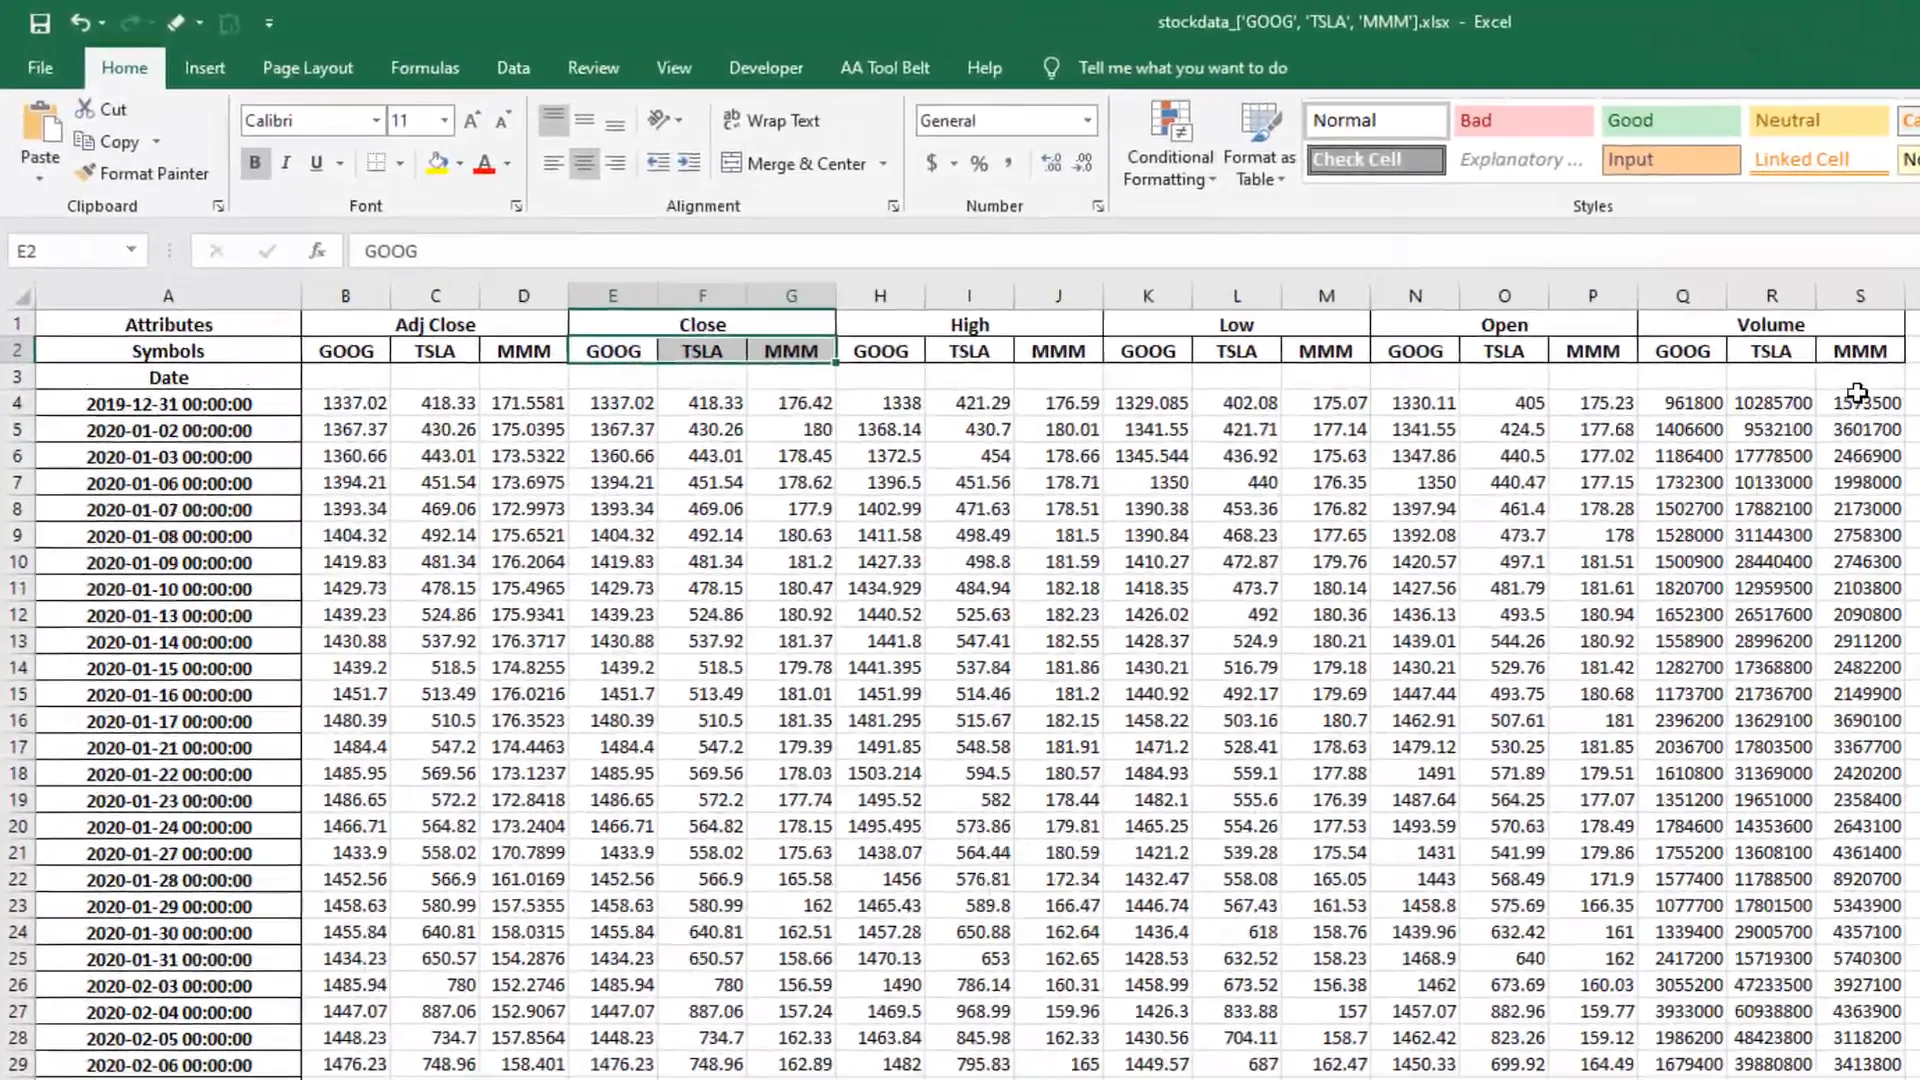
Retrieving Multiple Stocks
If you want to retrieve multiple stocks, you can create a list of ticker symbols. For example:
stocks = ['GOOG', 'TSLA', 'MMM']After saving the changes and running the script again, you should see an Excel file containing stock information for all specified ticker symbols.
Conclusion
In this tutorial, I covered how to easily retrieve stock information using Python and export it to Excel. You learned how to set up the required libraries, specify date ranges, choose ticker symbols, retrieve stock data, and export it to an Excel file. This process can be applied to multiple stocks as well, making it a flexible solution for your data needs.
I hope you found this tutorial useful!
Here is the full code (Updated)
import yfinance as yf # pip install yfinance
import pandas as pd # pip install pandas

start = "2020-01-01"
end= "2020-07-31"
tickers = 'GOOG TSLA MMM'

df = yf.download(tickers, start=start, end=end)
df.index = df.index.strftime('%Y-%m-%d')
df.to_excel('stocks.xlsx')