Turn Your Excel File Into A Web App With Python (fast & easy) | Streamlit Tutorial

Introduction
In this tutorial, I will guide you through the process of converting Excel files into a web application using the Python library Streamlit. Streamlit allows you to create interactive web applications directly in Python without needing any knowledge of HTML, CSS, or JavaScript. I will show you how to build a web app that displays data from an Excel file, along with interactive elements like charts and filters.
[Setup] Python Libraries
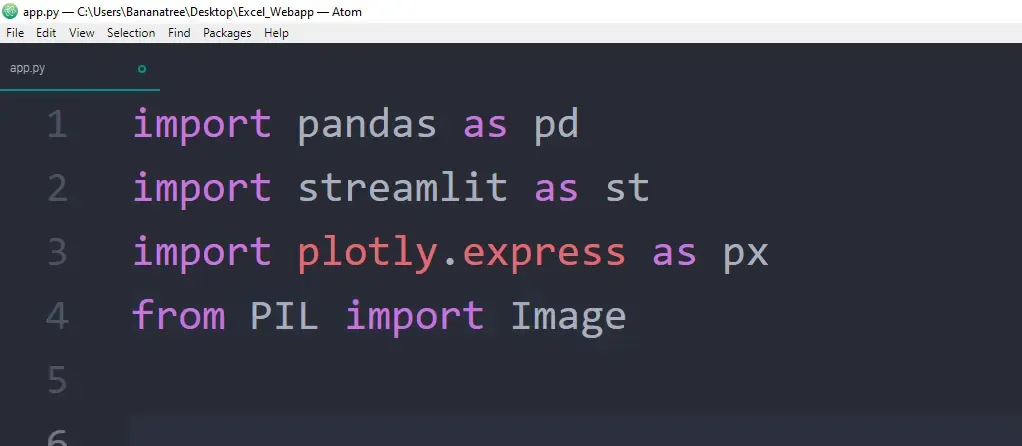
To get started, I need to set up the necessary Python libraries. This includes importing libraries such as pandas for data manipulation, streamlit for creating the web application, and plotly for visualizations. The code snippet below demonstrates how to import these libraries:
‘Hello World’ in Streamlit
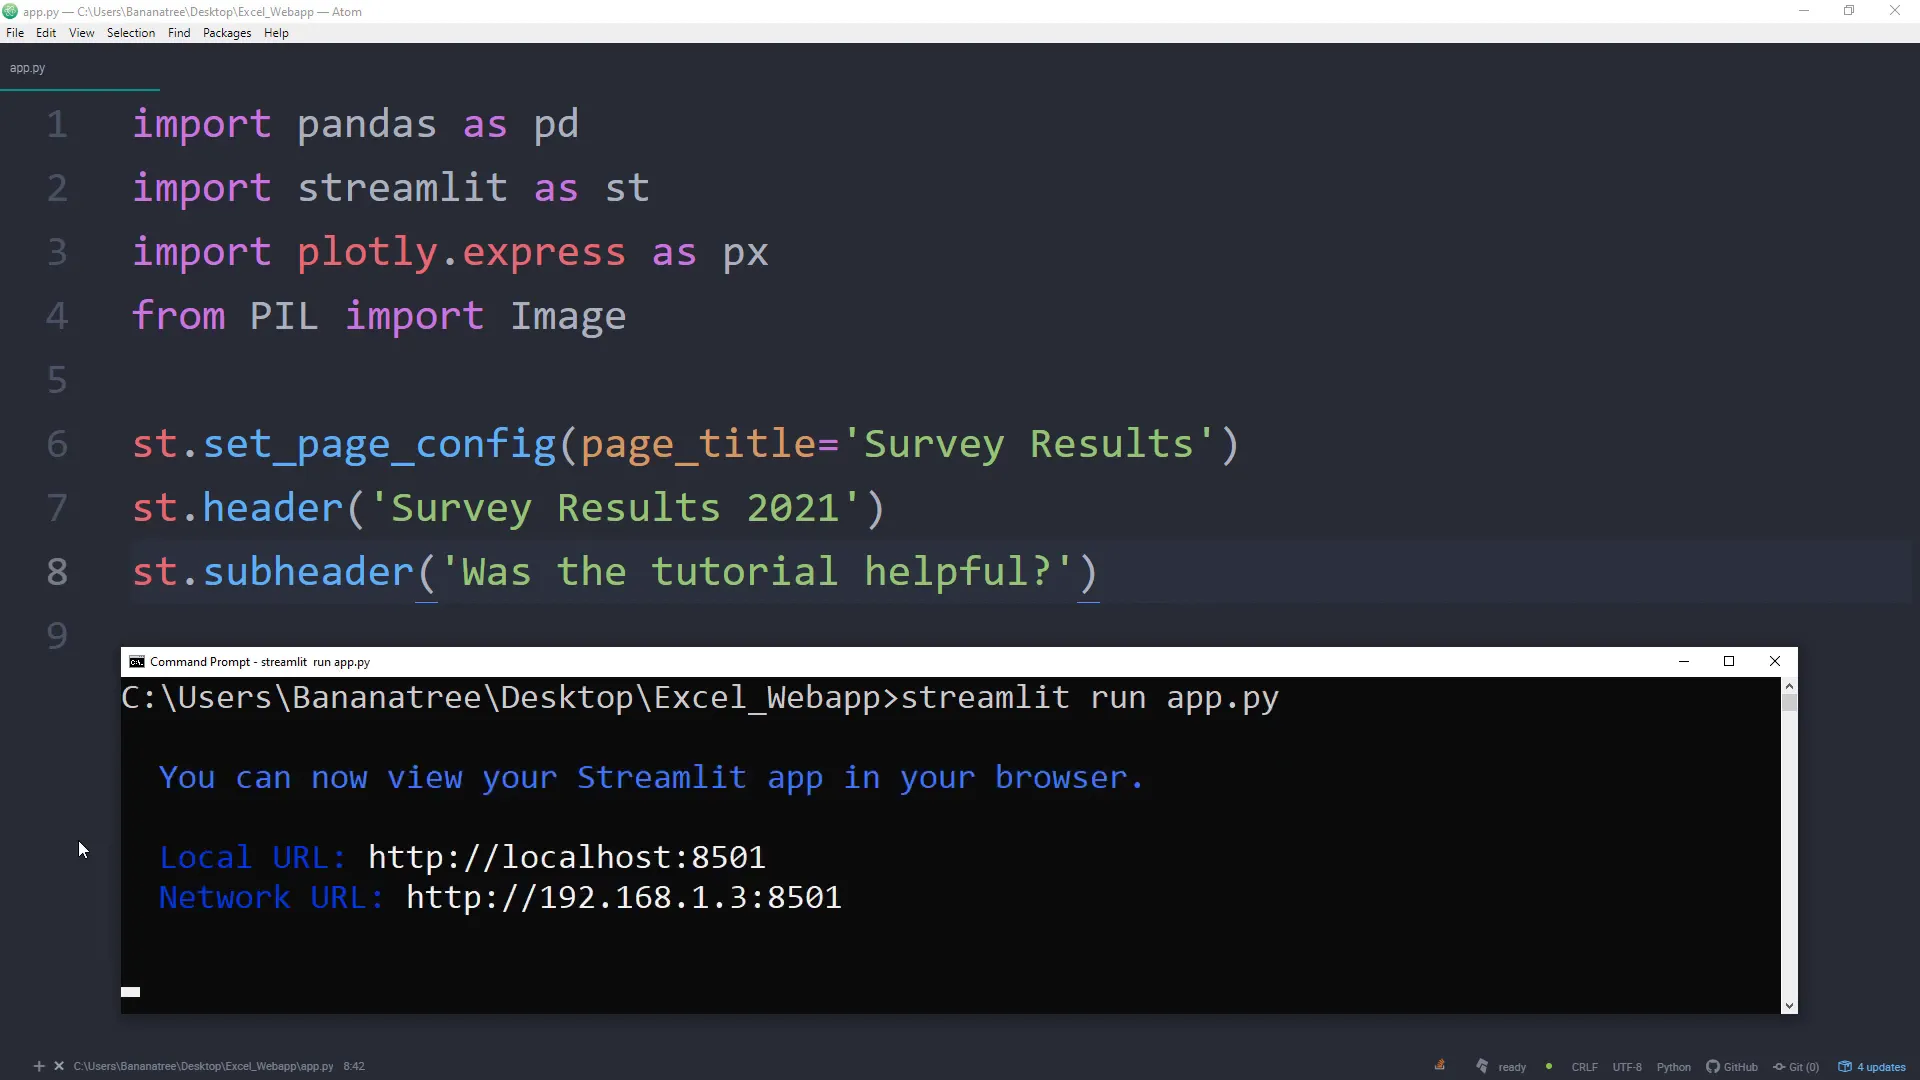
Once the libraries are imported, the first step is to create a simple ‘Hello World’ application. This is achieved by using Streamlit’s functions to display text on the web page. After running the application, I can open my web browser and see the output live.
Insert Dataframe in Streamlit
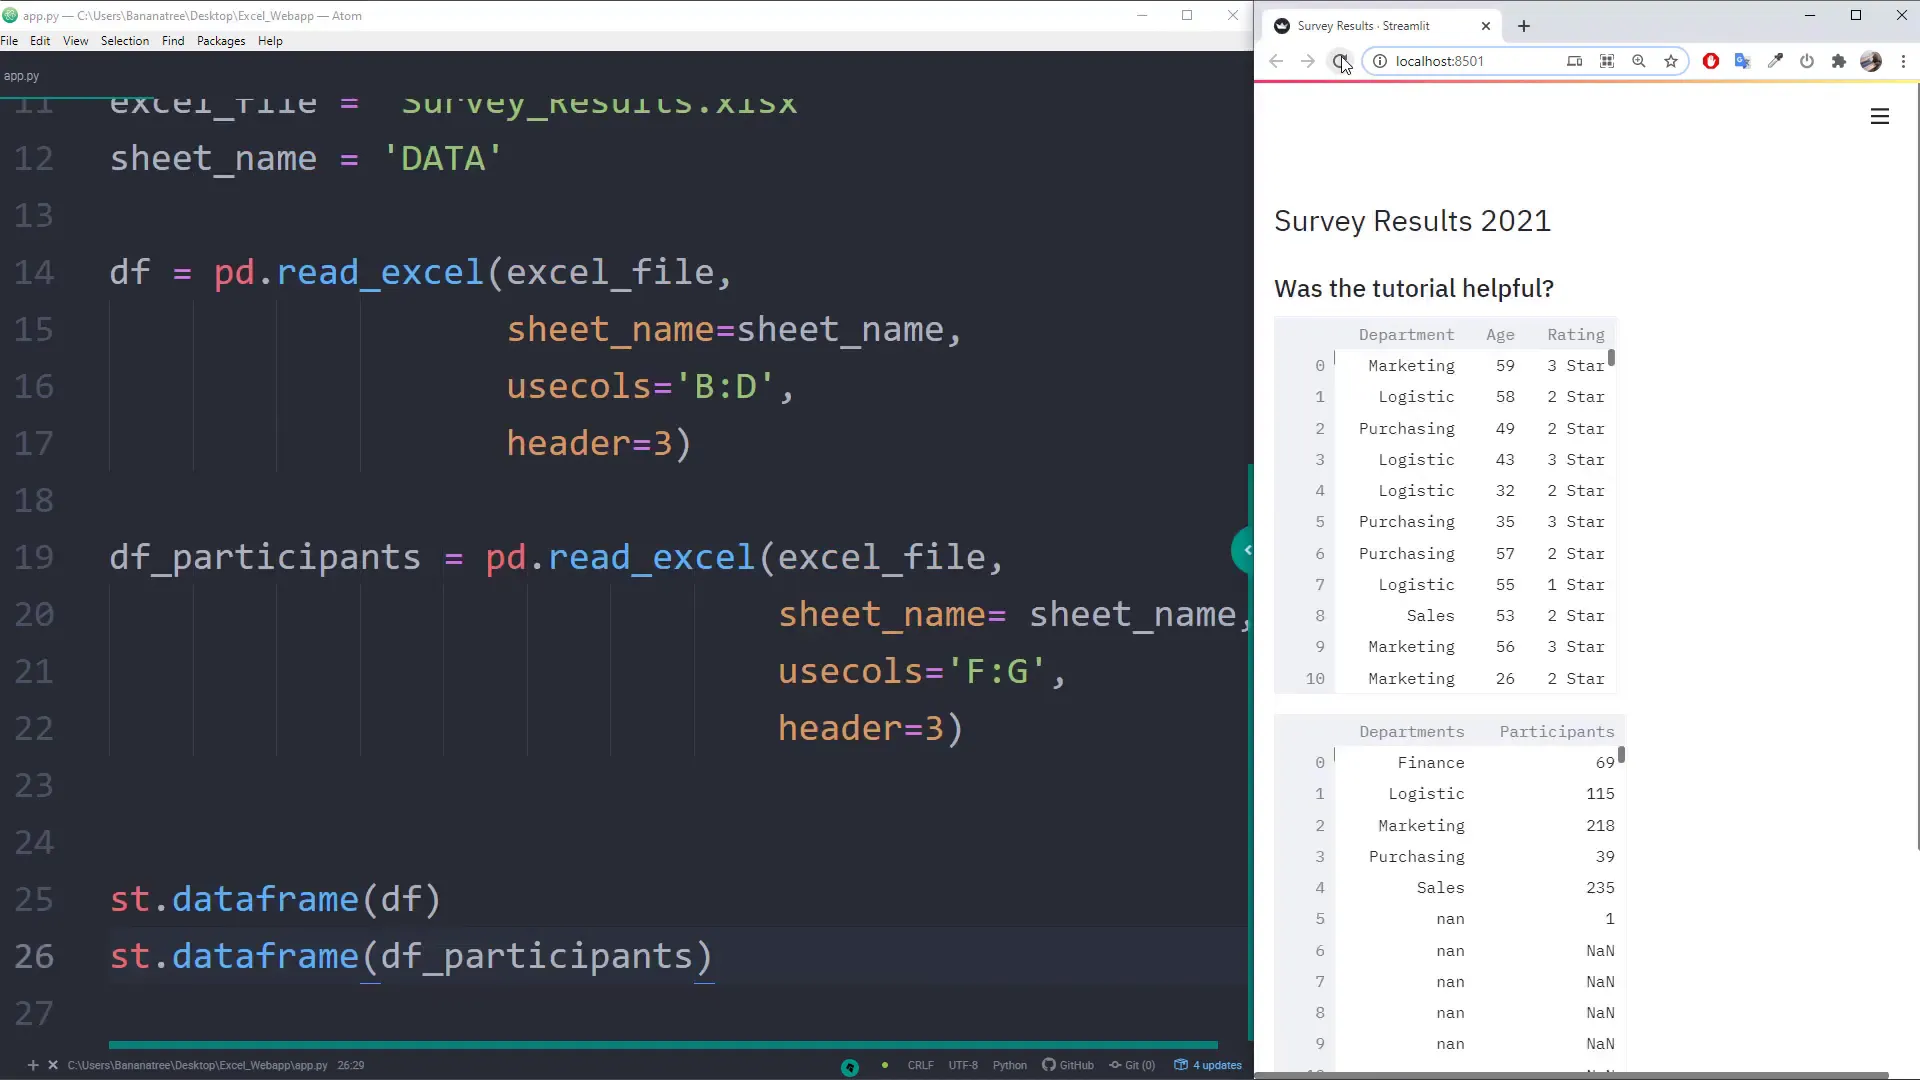
Next, I will load an Excel file into a pandas DataFrame and display it in the Streamlit app. This allows users to see the raw data in a tabular format. The data comes directly from the Excel file, which is updated whenever changes are made.
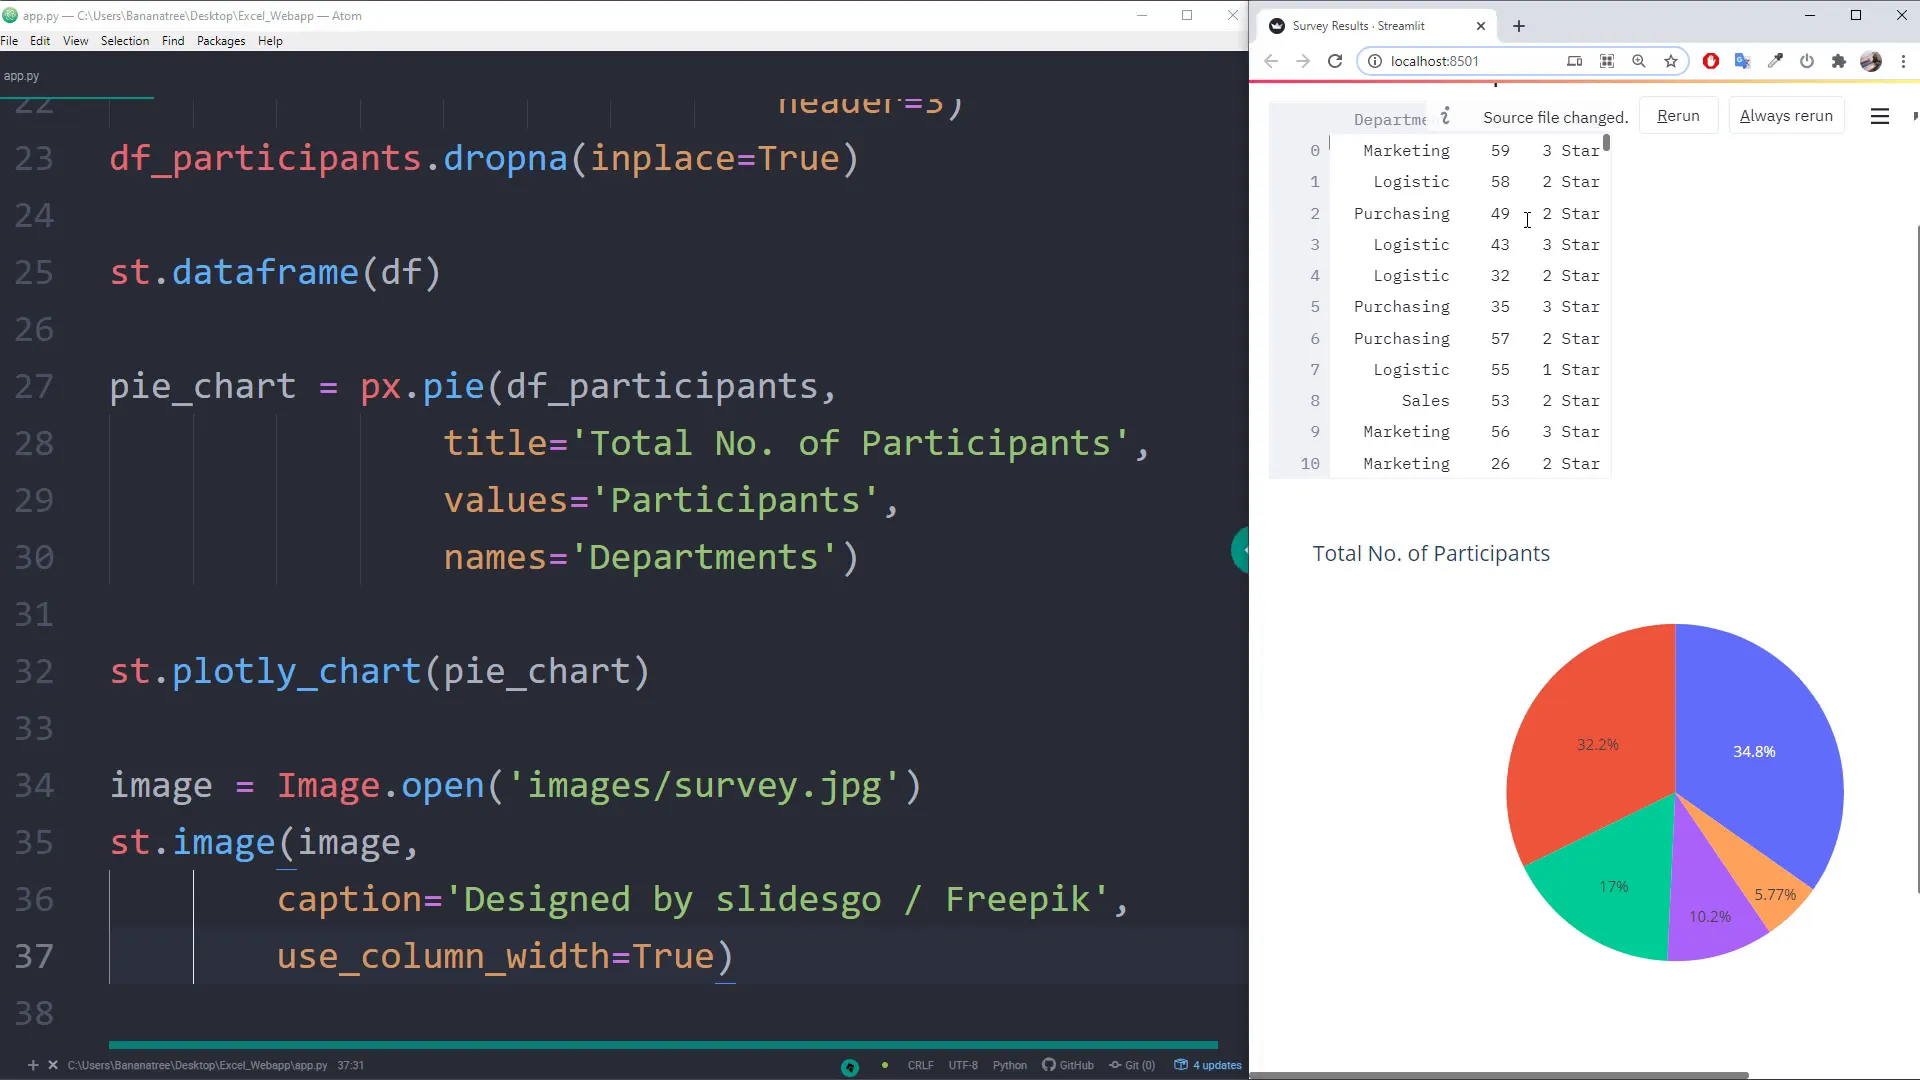
Insert Pie Chart in Streamlit
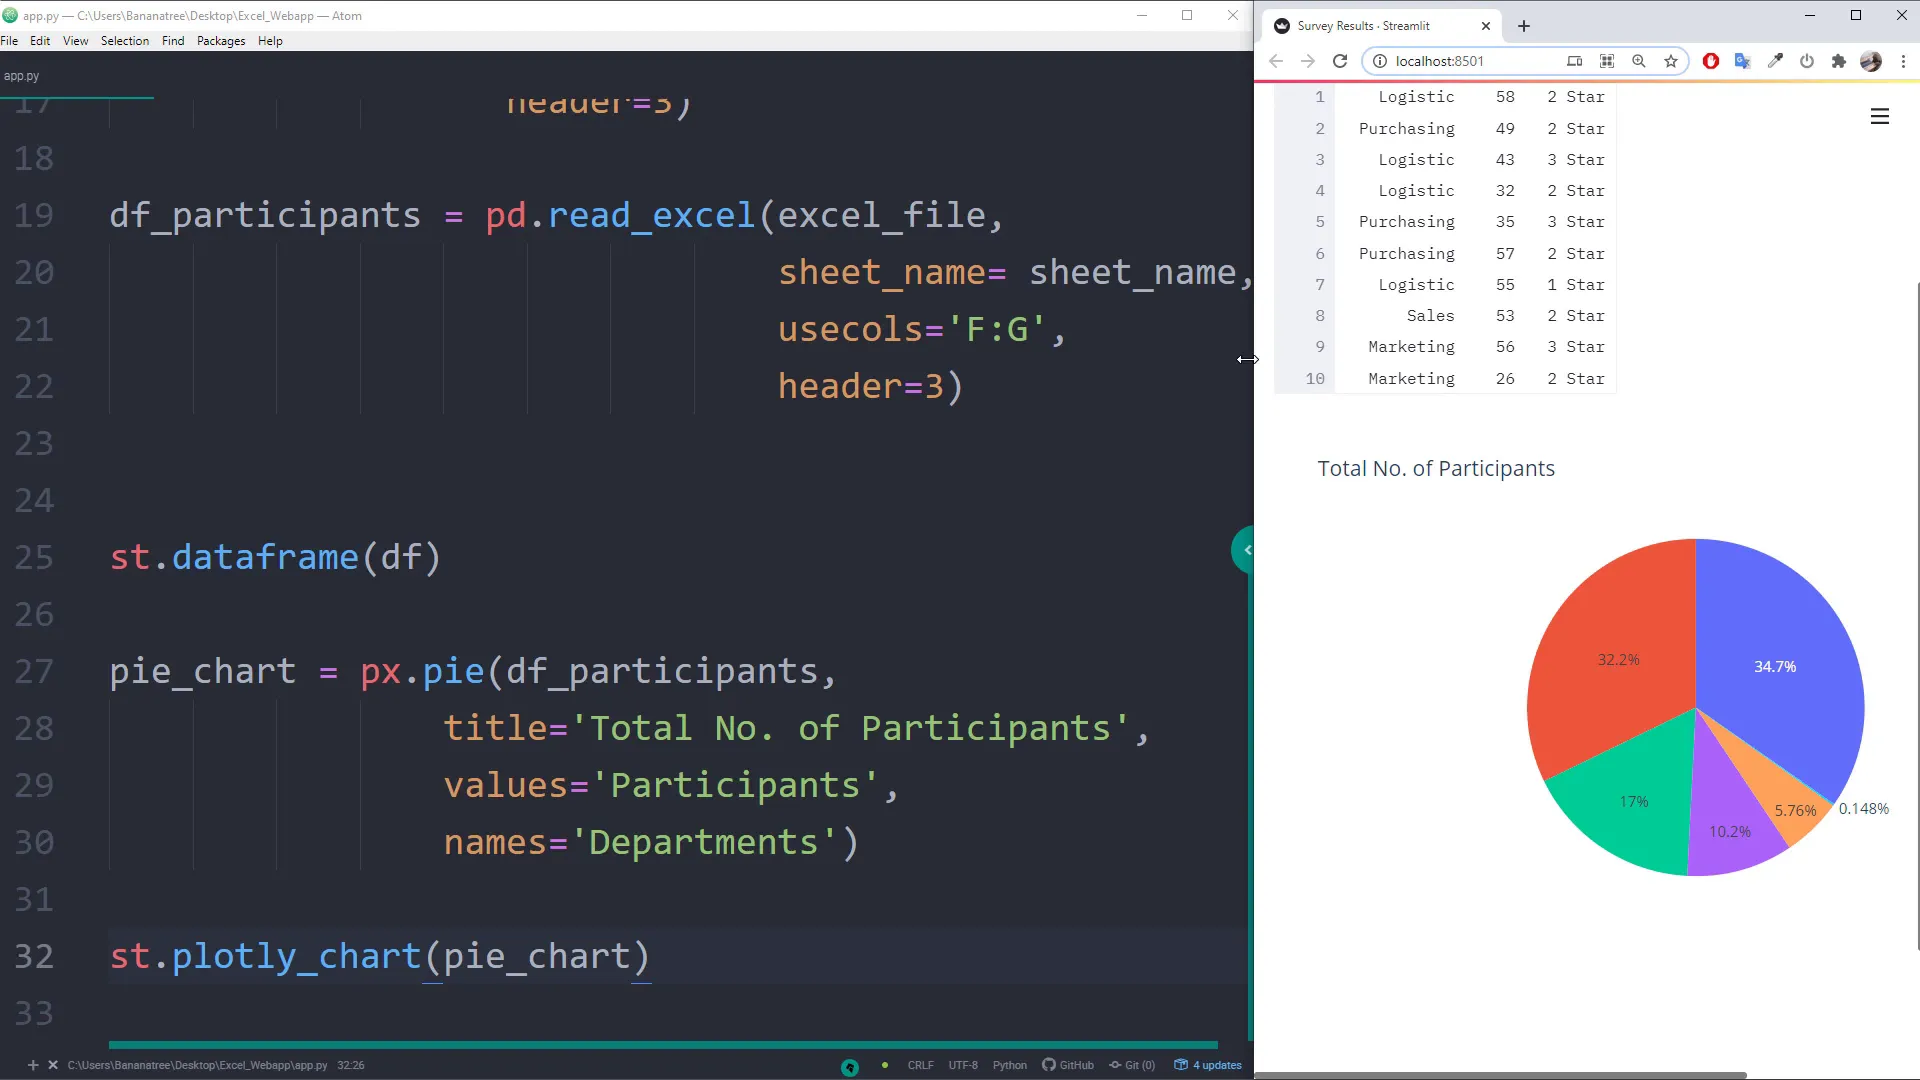
After displaying the DataFrame, I will create a pie chart using the data. This visual representation helps in understanding the distribution of different categories within the data. Streamlit makes it easy to integrate such charts seamlessly into the web app.
Insert Images in Streamlit
Images can also be incorporated into the Streamlit application. I will demonstrate how to display images stored in a designated folder, adding an extra layer of interactivity to the web app. This can be useful for visual representations alongside data.
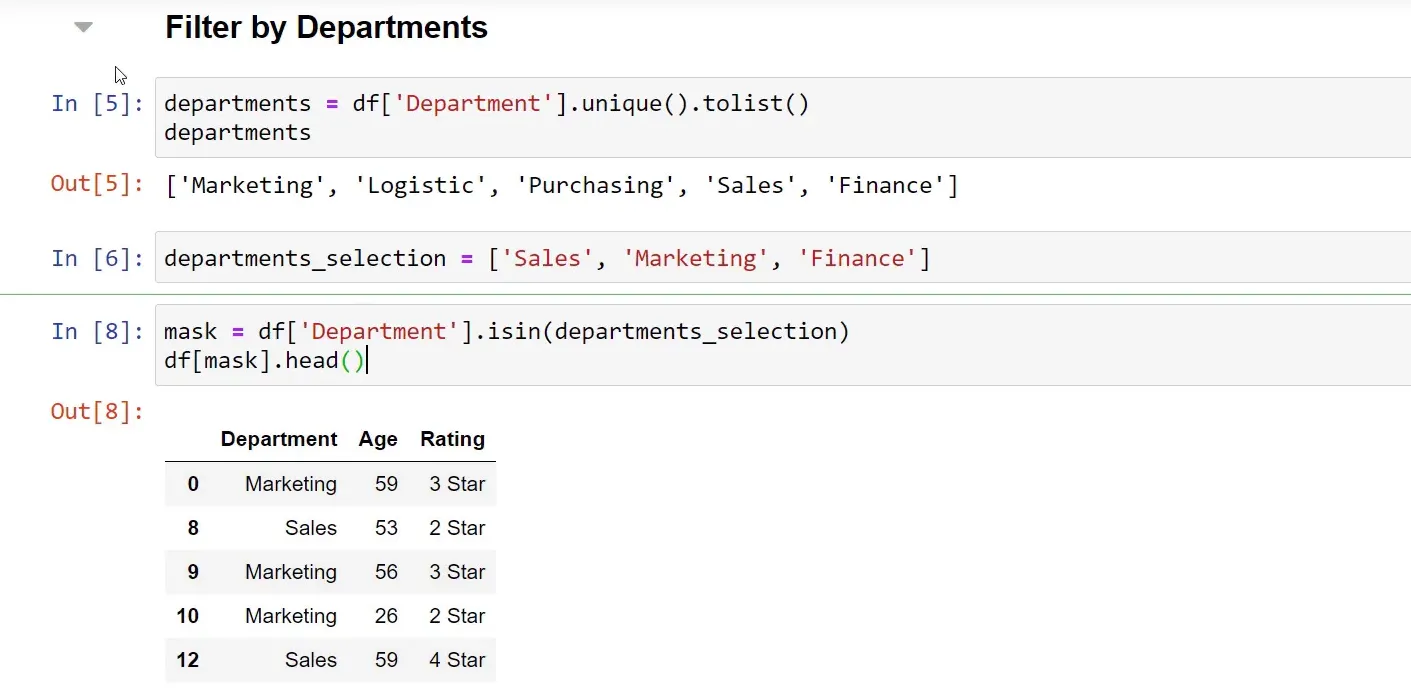
[Excursion] Filter & Group Dataframe in Pandas
Now, I will take a brief excursion to show how to filter and group the DataFrame using pandas. This is essential for data analysis, allowing me to extract relevant information based on specific criteria such as department or ratings.
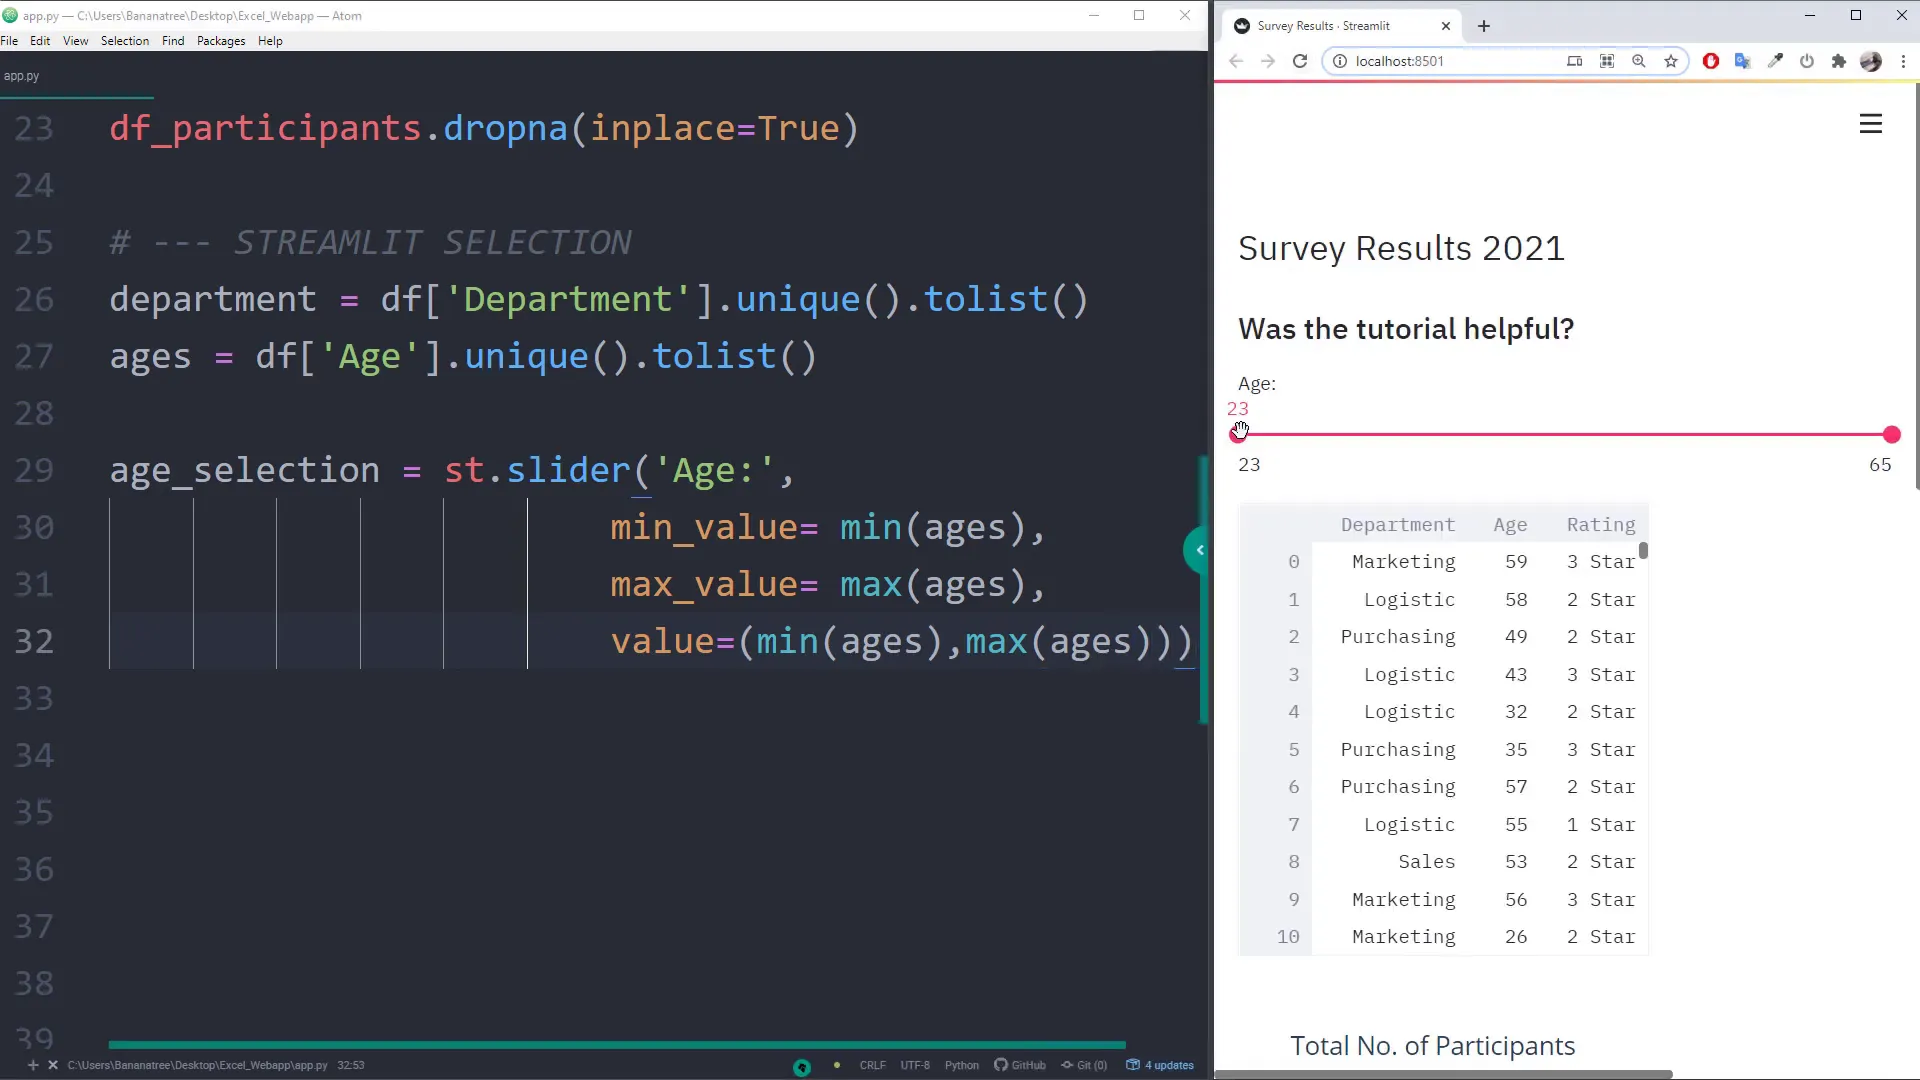
Insert Slider & Multiselect in Streamlit
To enhance user interaction, I will add a slider and a multiselect box to the app. These widgets will enable users to select specific ranges or multiple options from the data, making the web app more dynamic.
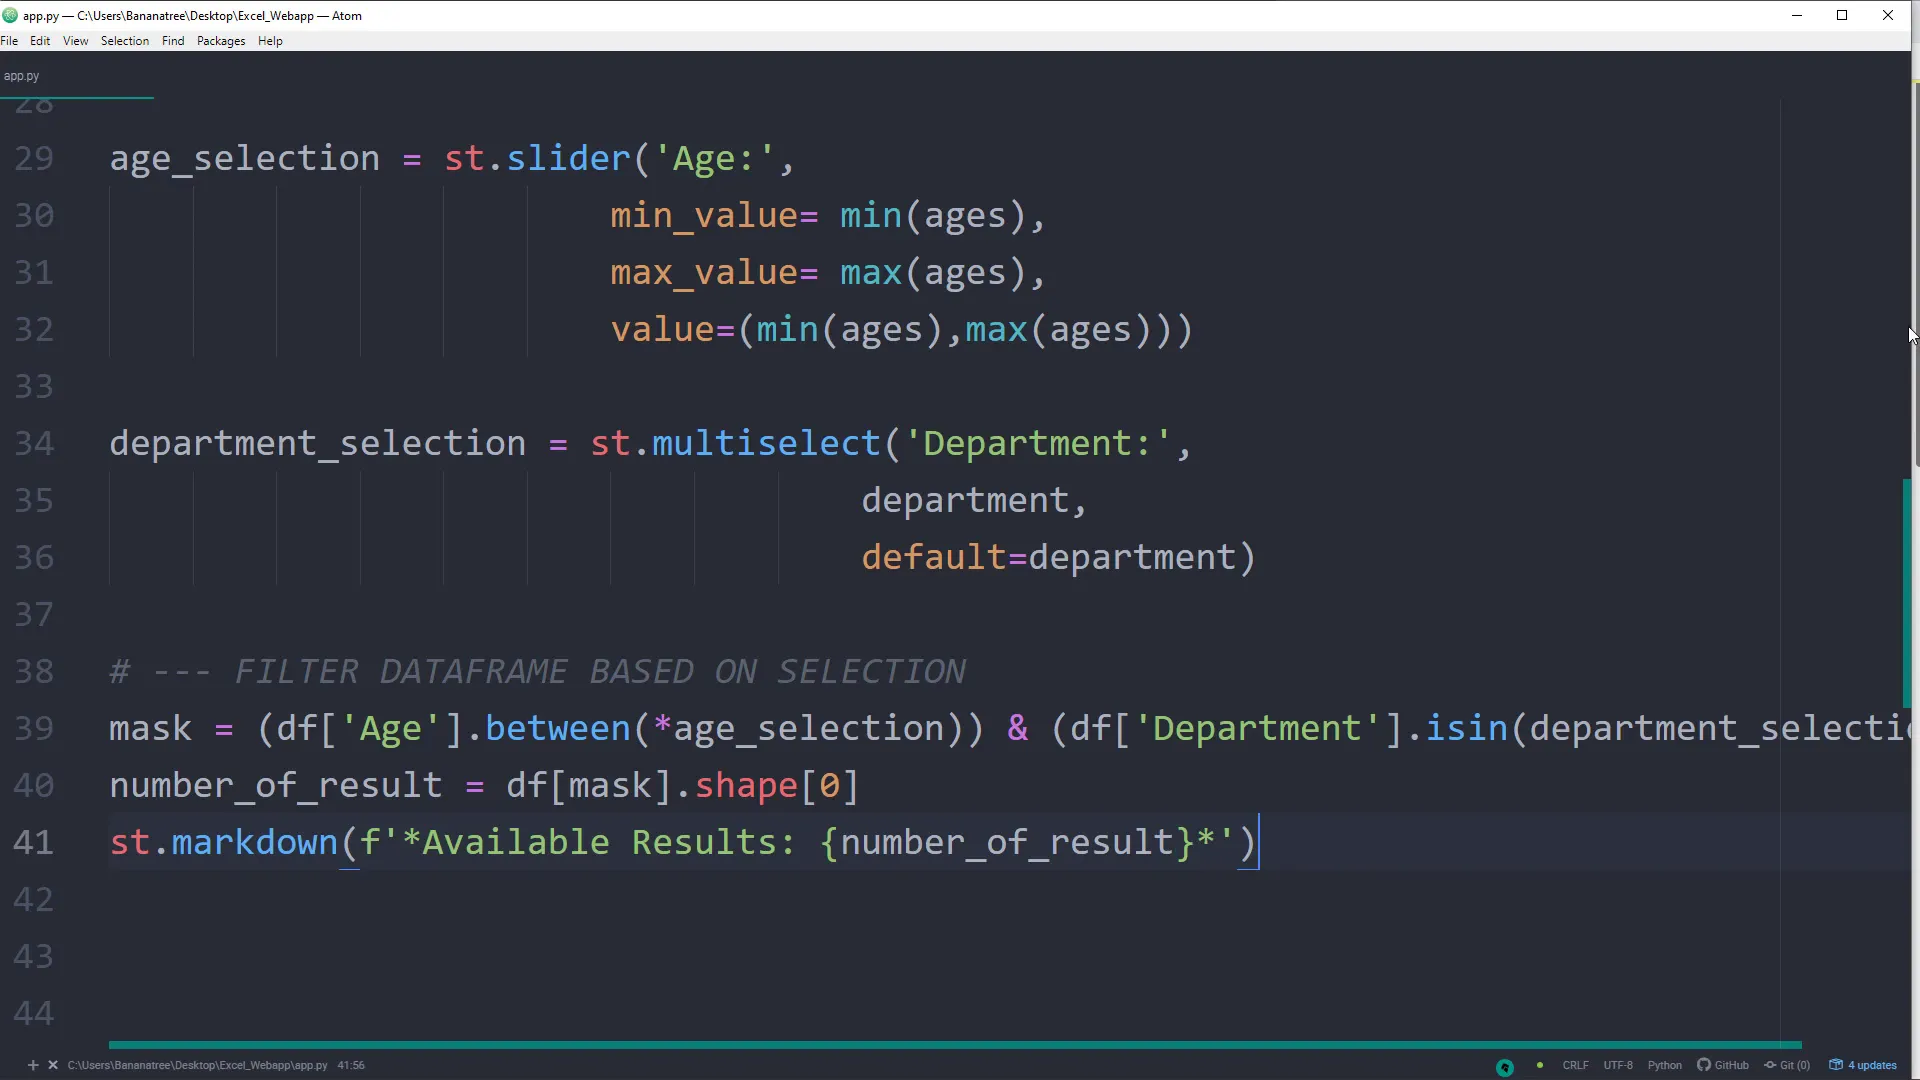
Filter Dataframe based on user selection
Based on the selections made by the user through the slider and multiselect, I will filter the DataFrame to display only relevant data. This functionality is crucial for personalized user experiences within the application.
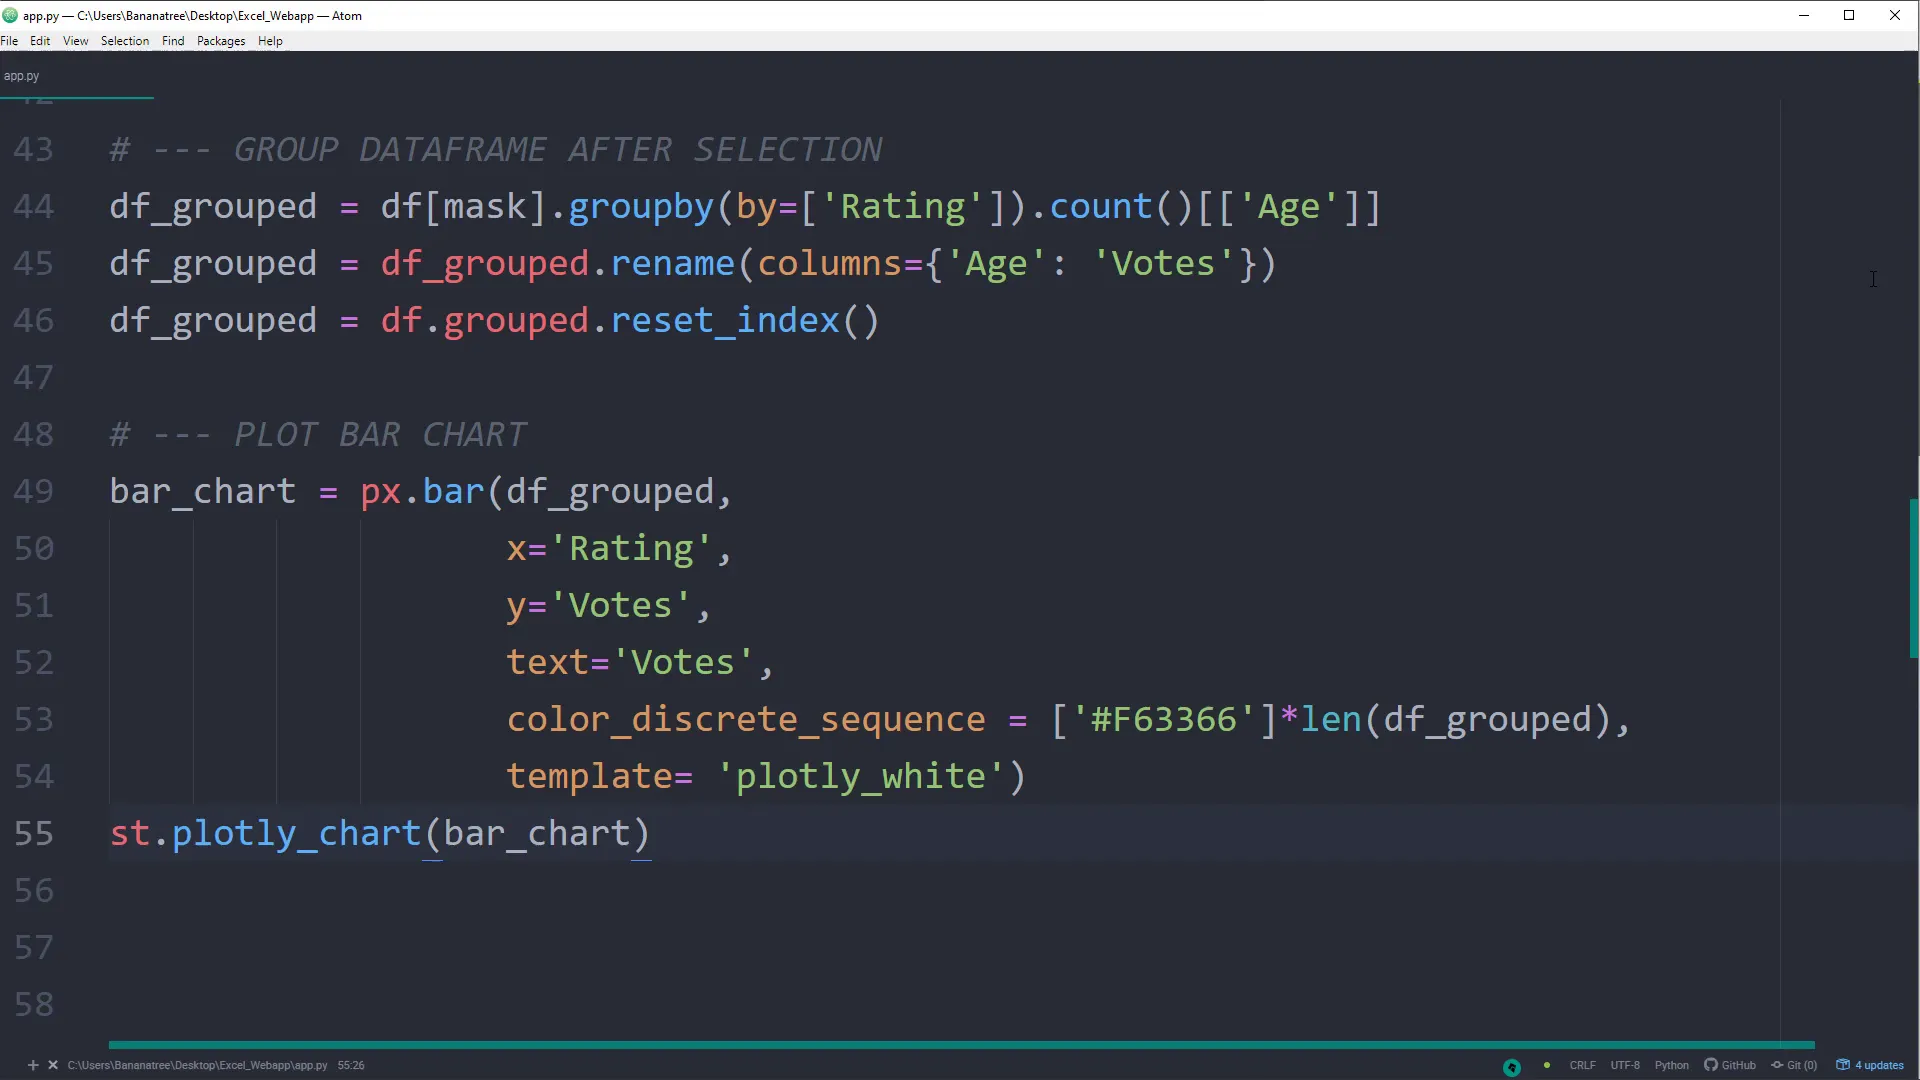
Group & Plot Dataframe after user selection
After filtering the data, I will group it according to the user’s selections and plot the results. This allows for a better visual understanding of the data trends based on user input.
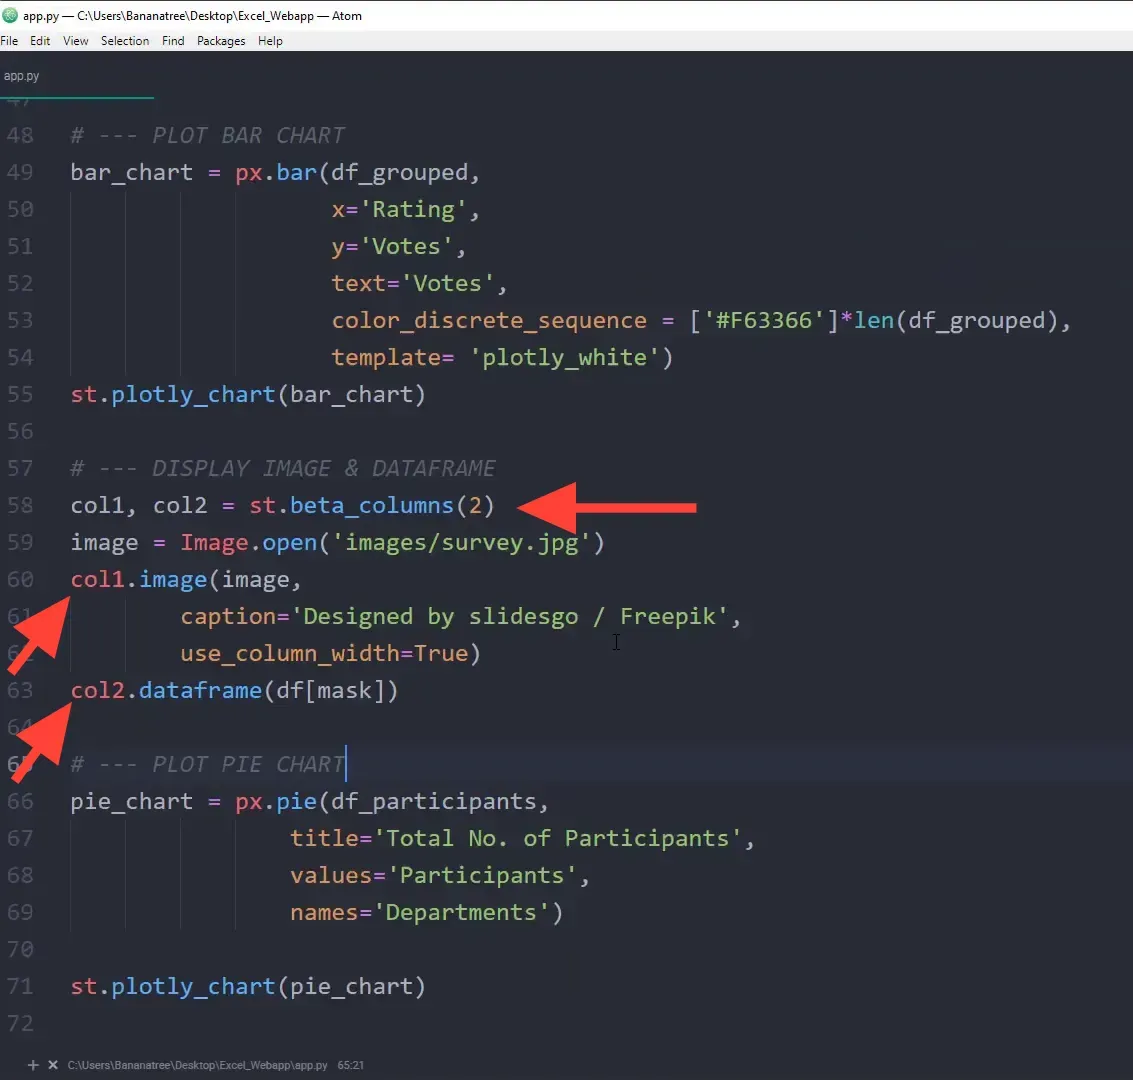
Use columns in Streamlit
Finally, I will demonstrate how to use columns in Streamlit to organize the layout of the web app. This helps in creating a more structured and visually appealing interface for users.
Final Word
In conclusion, I have shown how to create a web application from an Excel file using Streamlit. The application is interactive, allowing users to visualize and manipulate the data through various widgets and charts. Streamlit simplifies the process of building web applications, making it accessible for Python developers.
Thank you for following along with this tutorial. I hope you found it helpful and that you feel empowered to create your own web applications using Streamlit!