Export Excel Charts & Data to PowerPoint Automatically (Excel VBA Template)
Automate PowerPoint Using VBA: Introduction
You know that feeling when you’ve spent hours crunching numbers in Excel, crafting charts, and summarizing insights—only to face the dreaded task of manually copying everything into PowerPoint slide by slide? It’s like baking a cake and then having to plate each slice with a spoonful of frosting by hand. Tedious, time-consuming, and frankly, a buzzkill.
Well, I’ve been there. Back when I worked as a business analyst, every month I had to present the financial situation to management. The data lived in Excel, where I performed all my analysis and built charts. But assembling the PowerPoint deck? That was a whole other story—until I created a clever Excel VBA template that automates the entire process. Today, I’ll walk you through how you can automate PowerPoint using VBA to export your Excel data and charts seamlessly, saving you hours of repetitive work.
The Problem: Manual Copy-Pasting Sucks
Imagine this: every month, you finish your Excel report. You have updated pivot tables, fresh charts, and key insights ready to share. But then, the clock starts ticking as you painstakingly copy each chart into PowerPoint, resize it, and retype your summaries. Not only is this inefficient, but it also leaves room for errors and inconsistencies.
That’s exactly why I built an Excel VBA template that acts like a magic wand—one click and your entire presentation updates itself with the latest data. No more fiddling around with screenshots or reformatting slides.
How Does It Work? Meet the Template and Control Panel
Let’s break it down in plain English before diving into the technical bits. The solution consists of two parts:
- A PowerPoint Template: This is your presentation skeleton. You create slides with placeholders—think of these as sticky notes that say “insert title here” or “put chart here.”
- An Excel Workbook with VBA Macros: This workbook holds your data, charts, and a control panel where you tell the VBA code which Excel ranges go to which PowerPoint slides and what text should replace each placeholder.
Once set up, pressing the export button in Excel triggers the VBA code to open your PowerPoint template, replace all placeholder text with actual values from Excel, and insert your charts as images on the right slides. Voilà—your presentation is ready to go!
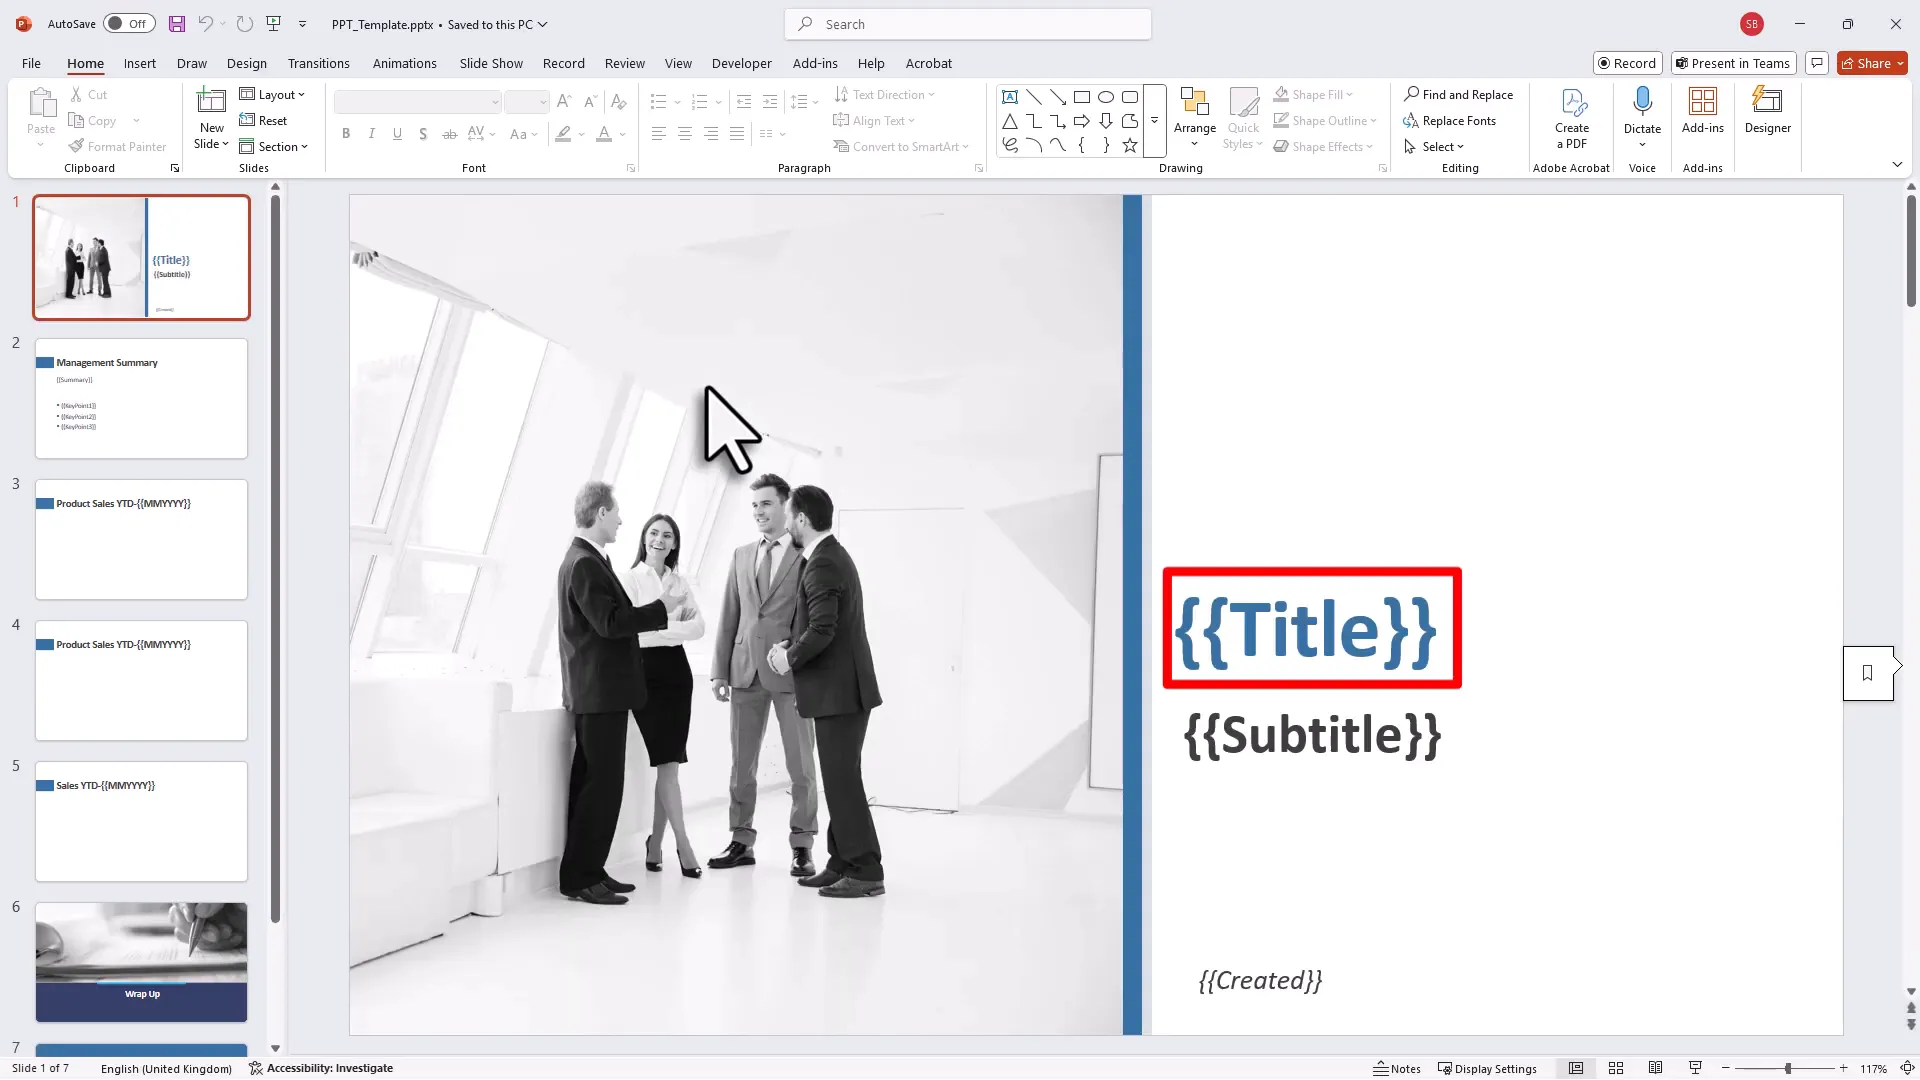
Step 1: Prepare Your PowerPoint Template
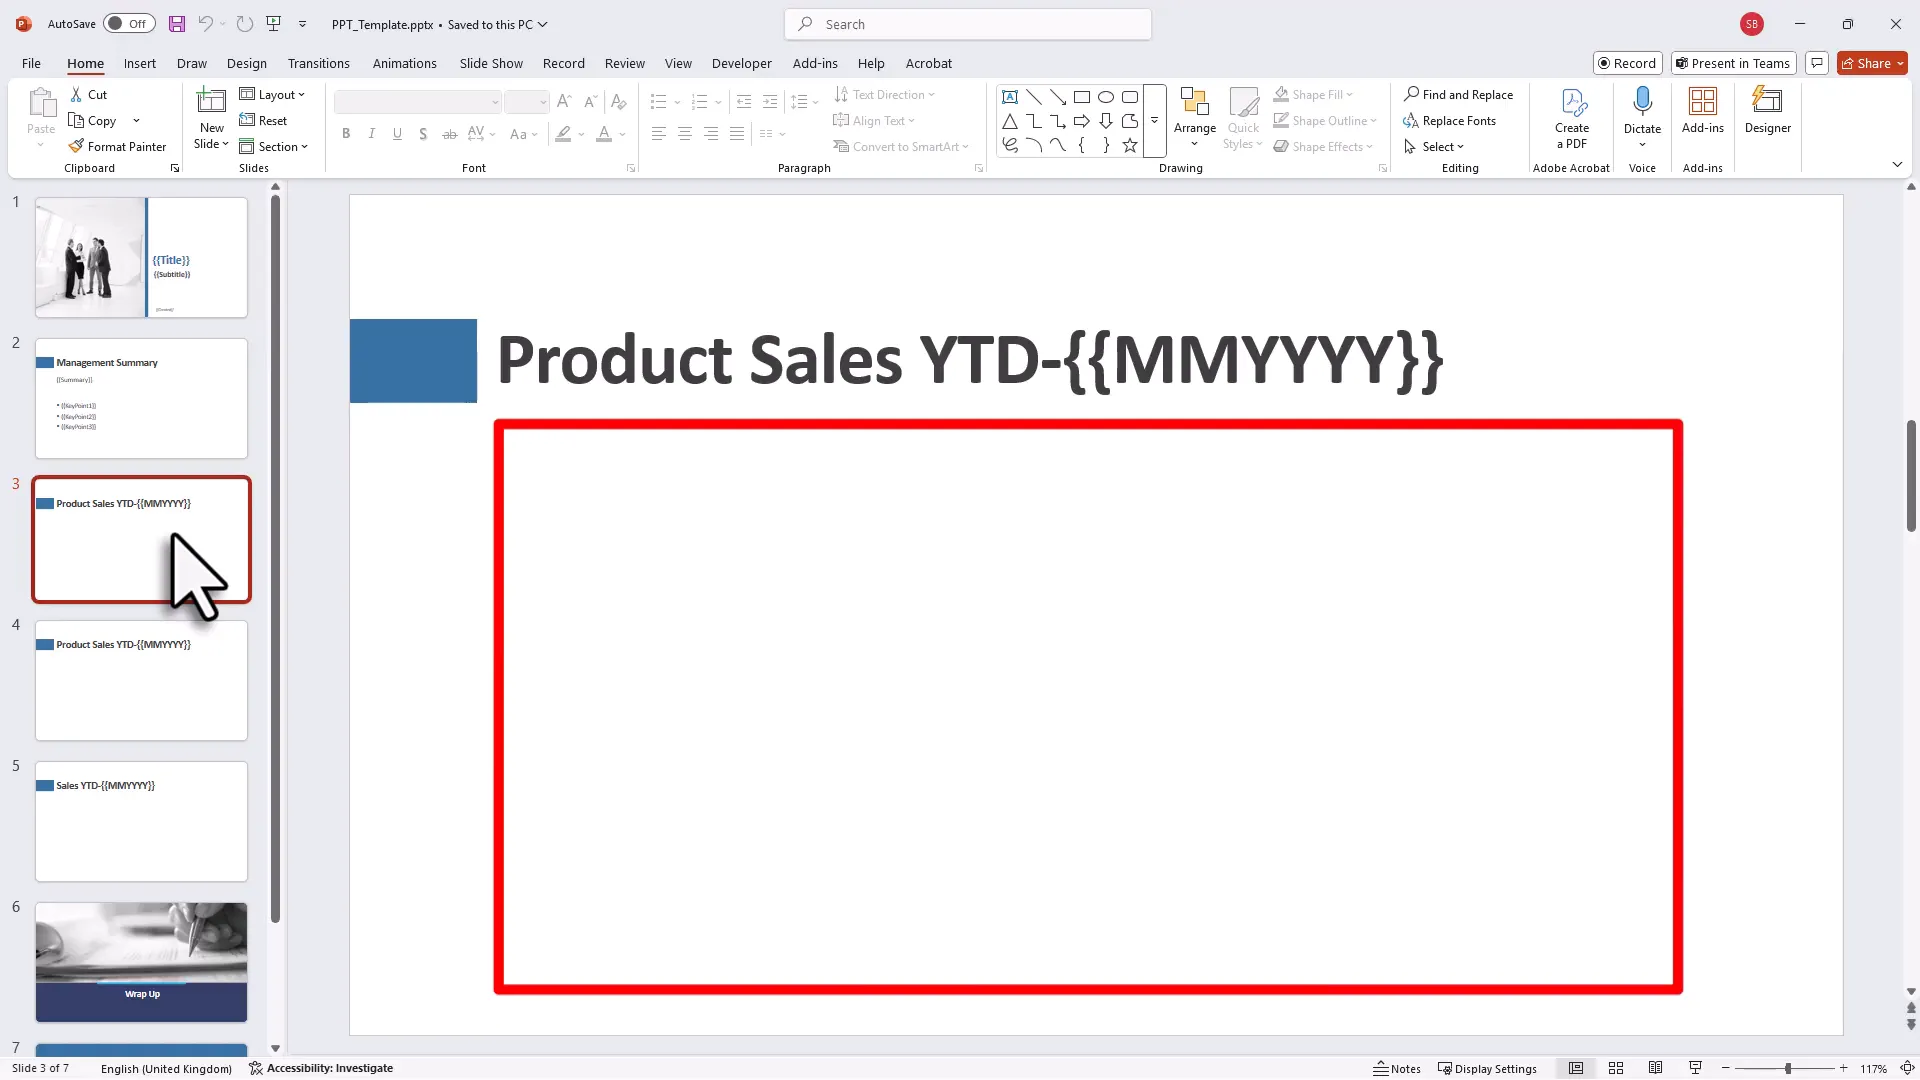
Start with a blank or existing PowerPoint file. Add placeholders for all the text elements you want to dynamically update, such as the title, subtitle, creation date, management summary, and key points. For the charts, add blank slides with a title placeholder and empty space where the charts will go later.
This setup might feel like laying the foundation of a house—you don’t see the rooms yet, but you know where the walls will go.
Step 2: Organize Your Excel Workbook
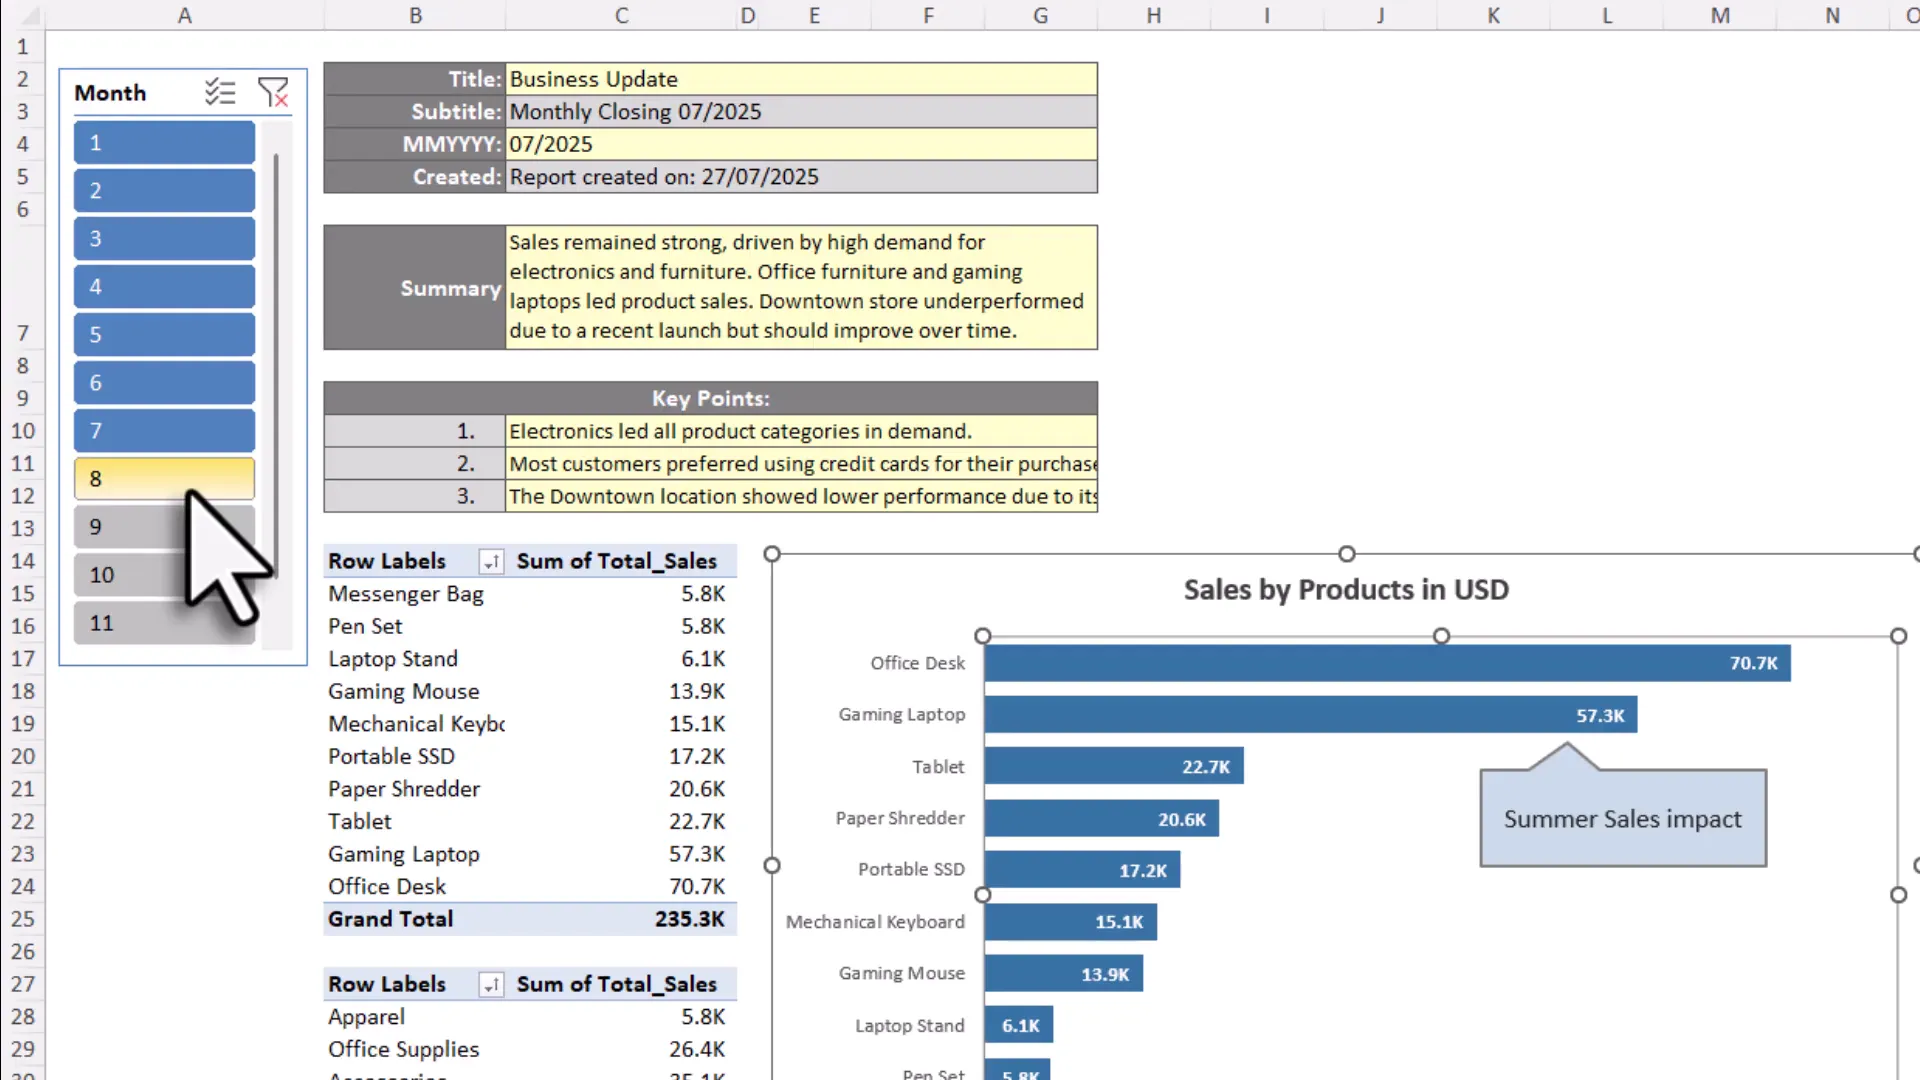
Inside your Excel file, keep your source data in one sheet—like sales transactions and product details. Build your reports and charts on another sheet. Here, you can also add input cells for management summaries or key findings, plus metadata like the report title and month.
To keep things flexible, I used pivot slicers to update charts based on the selected month. When new data arrives, adjusting the slicer refreshes everything automatically. (It’s like having a remote control for your data.)
Step 3: Use Named Ranges for Smooth Linking
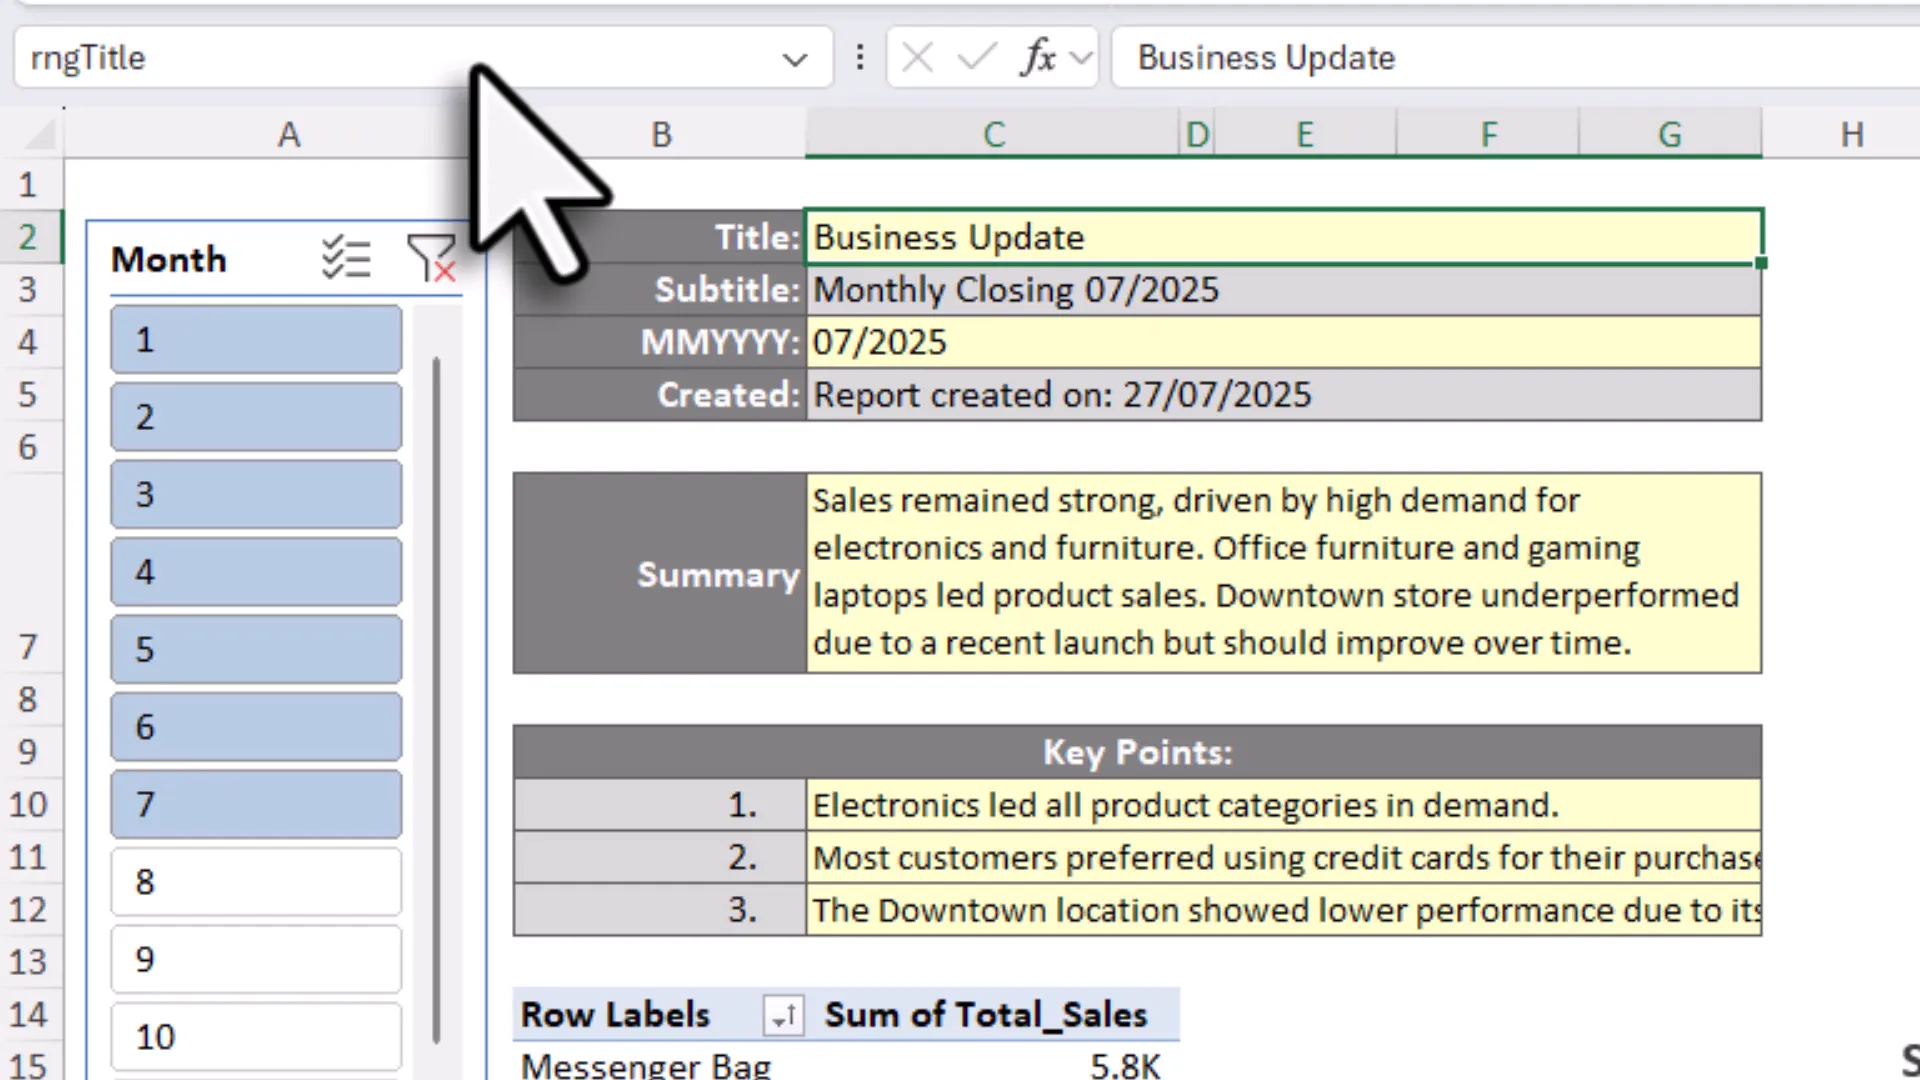
This is where the magic of automate PowerPoint using VBA really shines. Instead of hardcoding cell addresses, you assign named ranges to the cells or ranges you want to export.
For example, name the cell holding your report title as rngTitle, the summary text as rngSummary, and the range covering a chart as rngSalesByProduct. Named ranges make your VBA code cleaner and let you easily update references later without hunting for cell coordinates.
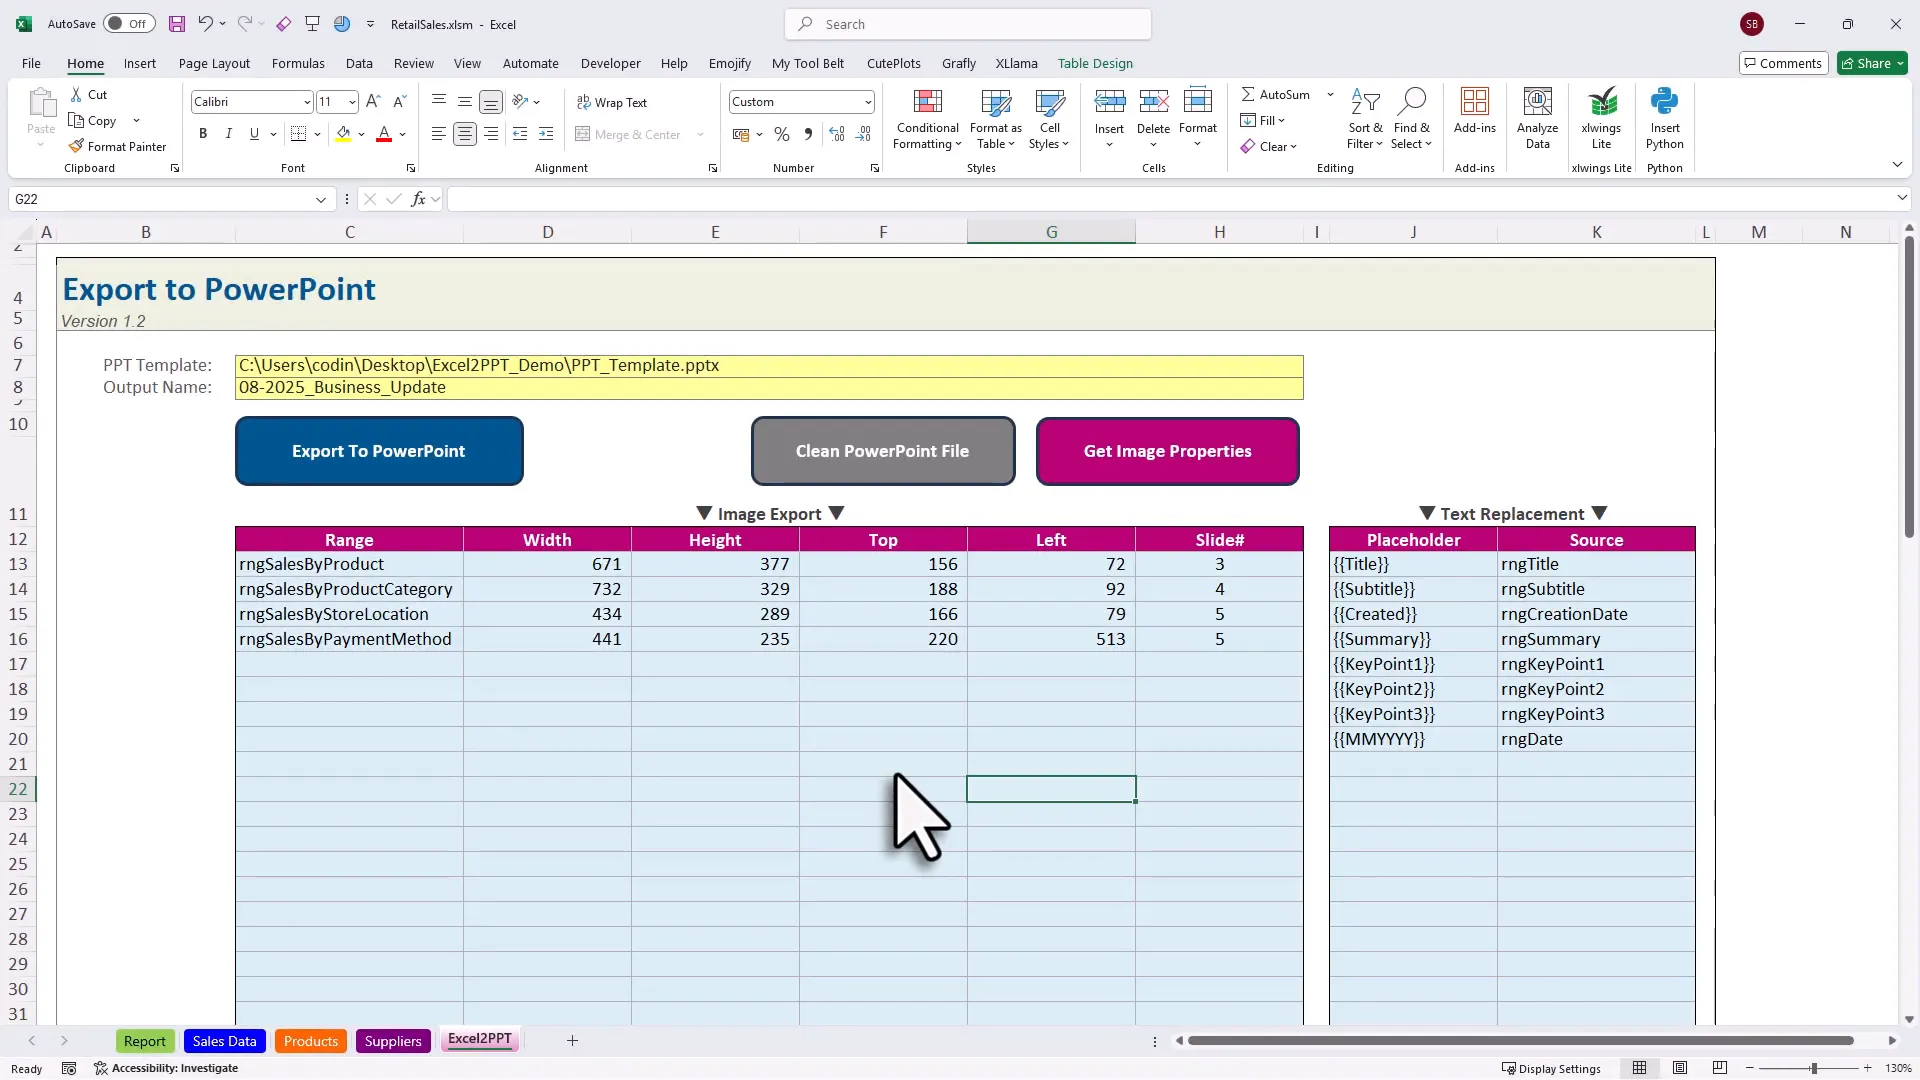
Step 4: Set Up the Export Control Panel
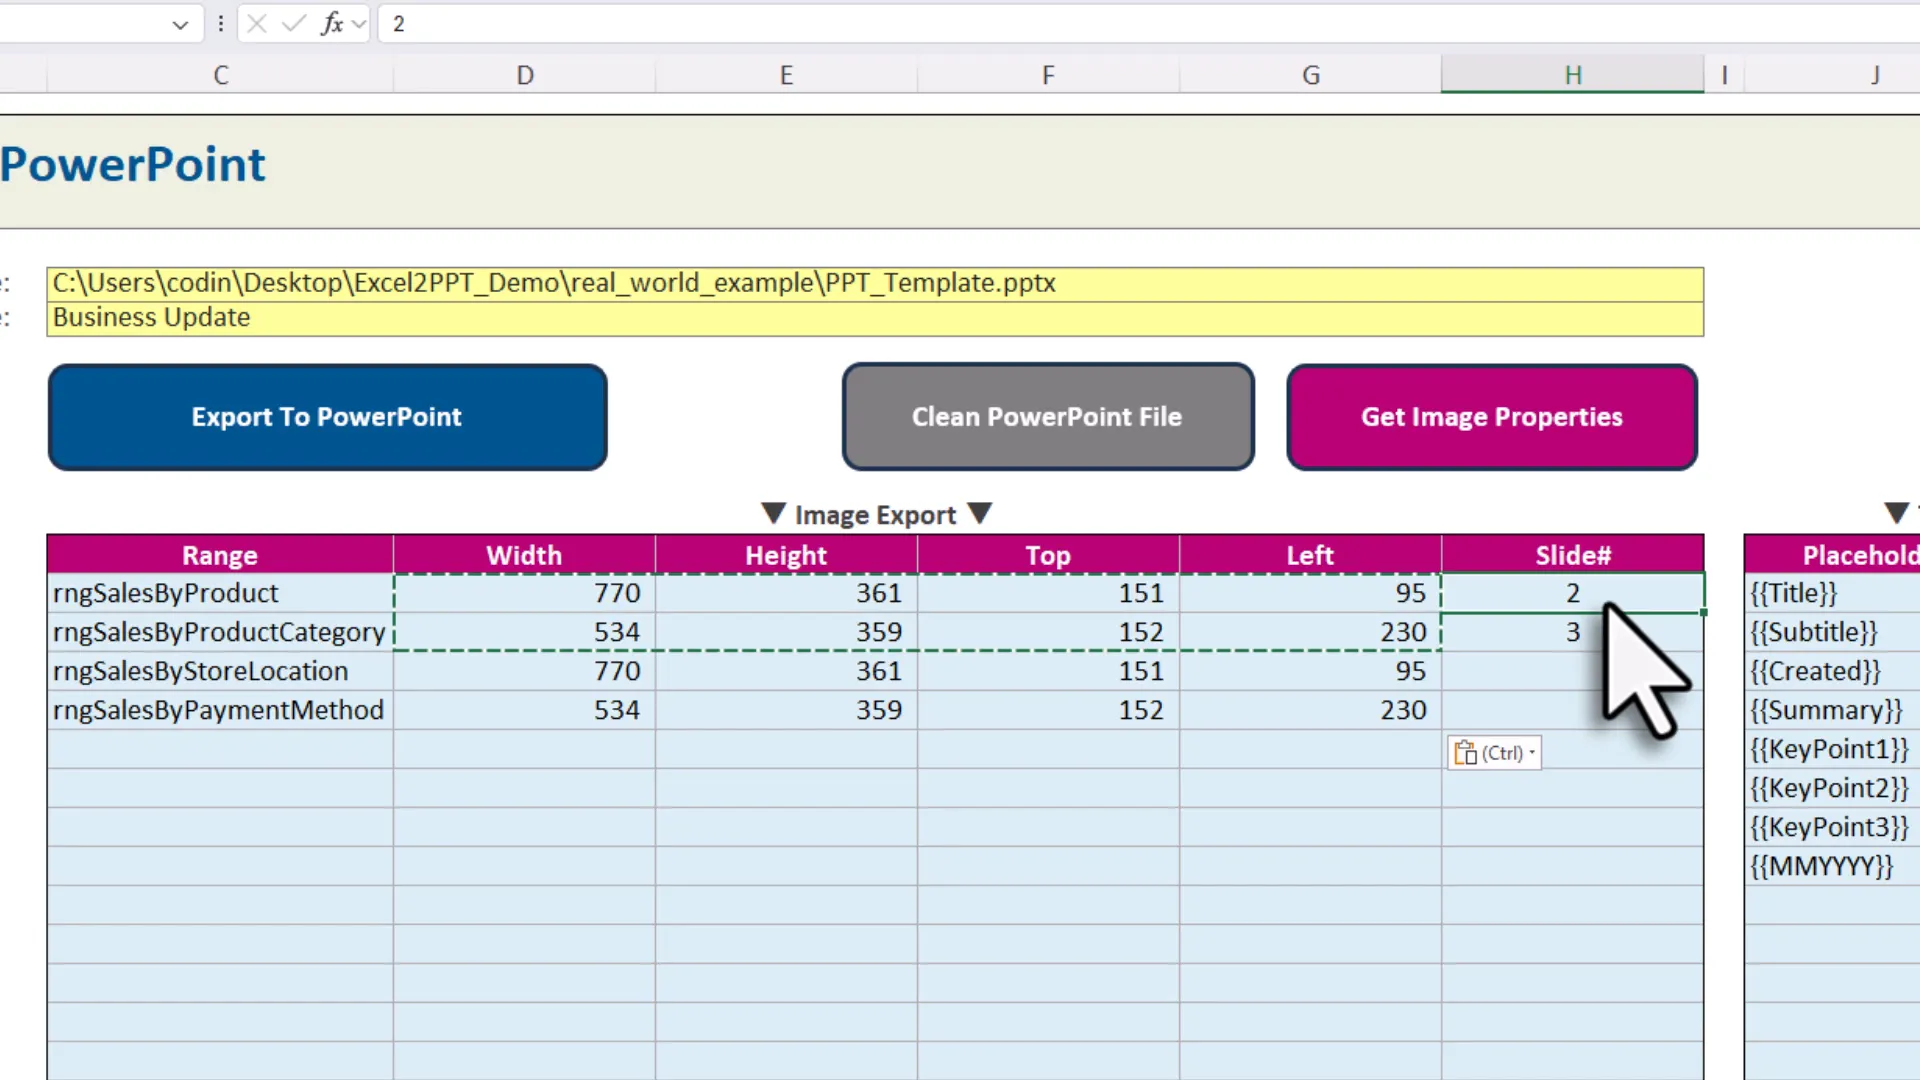
In the export sheet, you do two things:
- Paste the file path to your PowerPoint template (tip: right-click the PowerPoint file, choose “Copy as path,” and paste it in Excel, removing any quotation marks).
- Map your named ranges to the corresponding PowerPoint placeholders and specify which slide each chart should go to.
Think of this as programming your presentation’s GPS—telling it exactly where to go and what to show.
Putting It All Together: Exporting Your Presentation
Once everything is set up, hit the export button in Excel. The VBA code kicks in:
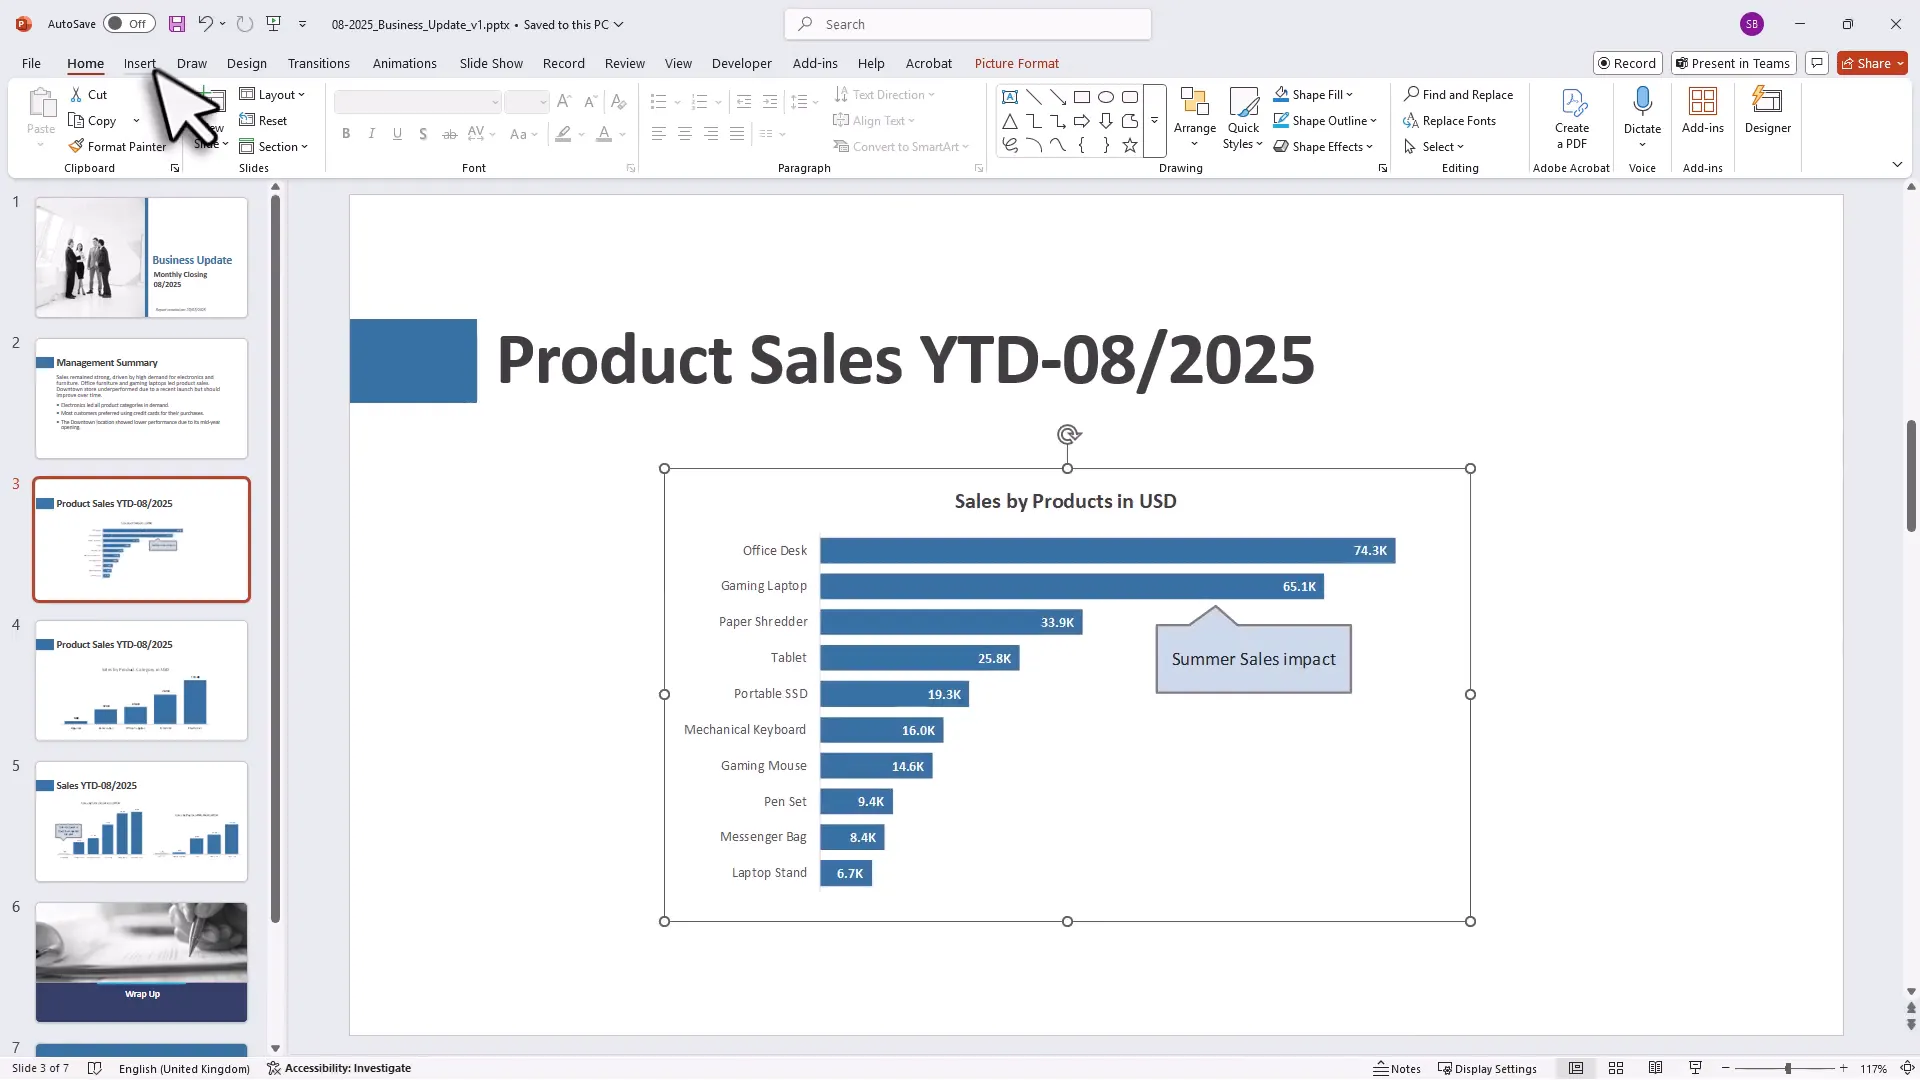
- It opens your PowerPoint template.
- Replaces all text placeholders with values from Excel.
- Takes snapshots of the selected Excel ranges (charts, tables, whatever you included).
- Inserts those snapshots as images on the correct slides.
Within seconds, you get a fully updated PowerPoint deck—no manual copy-pasting, no resizing headaches.
Fine-Tuning Your Presentation
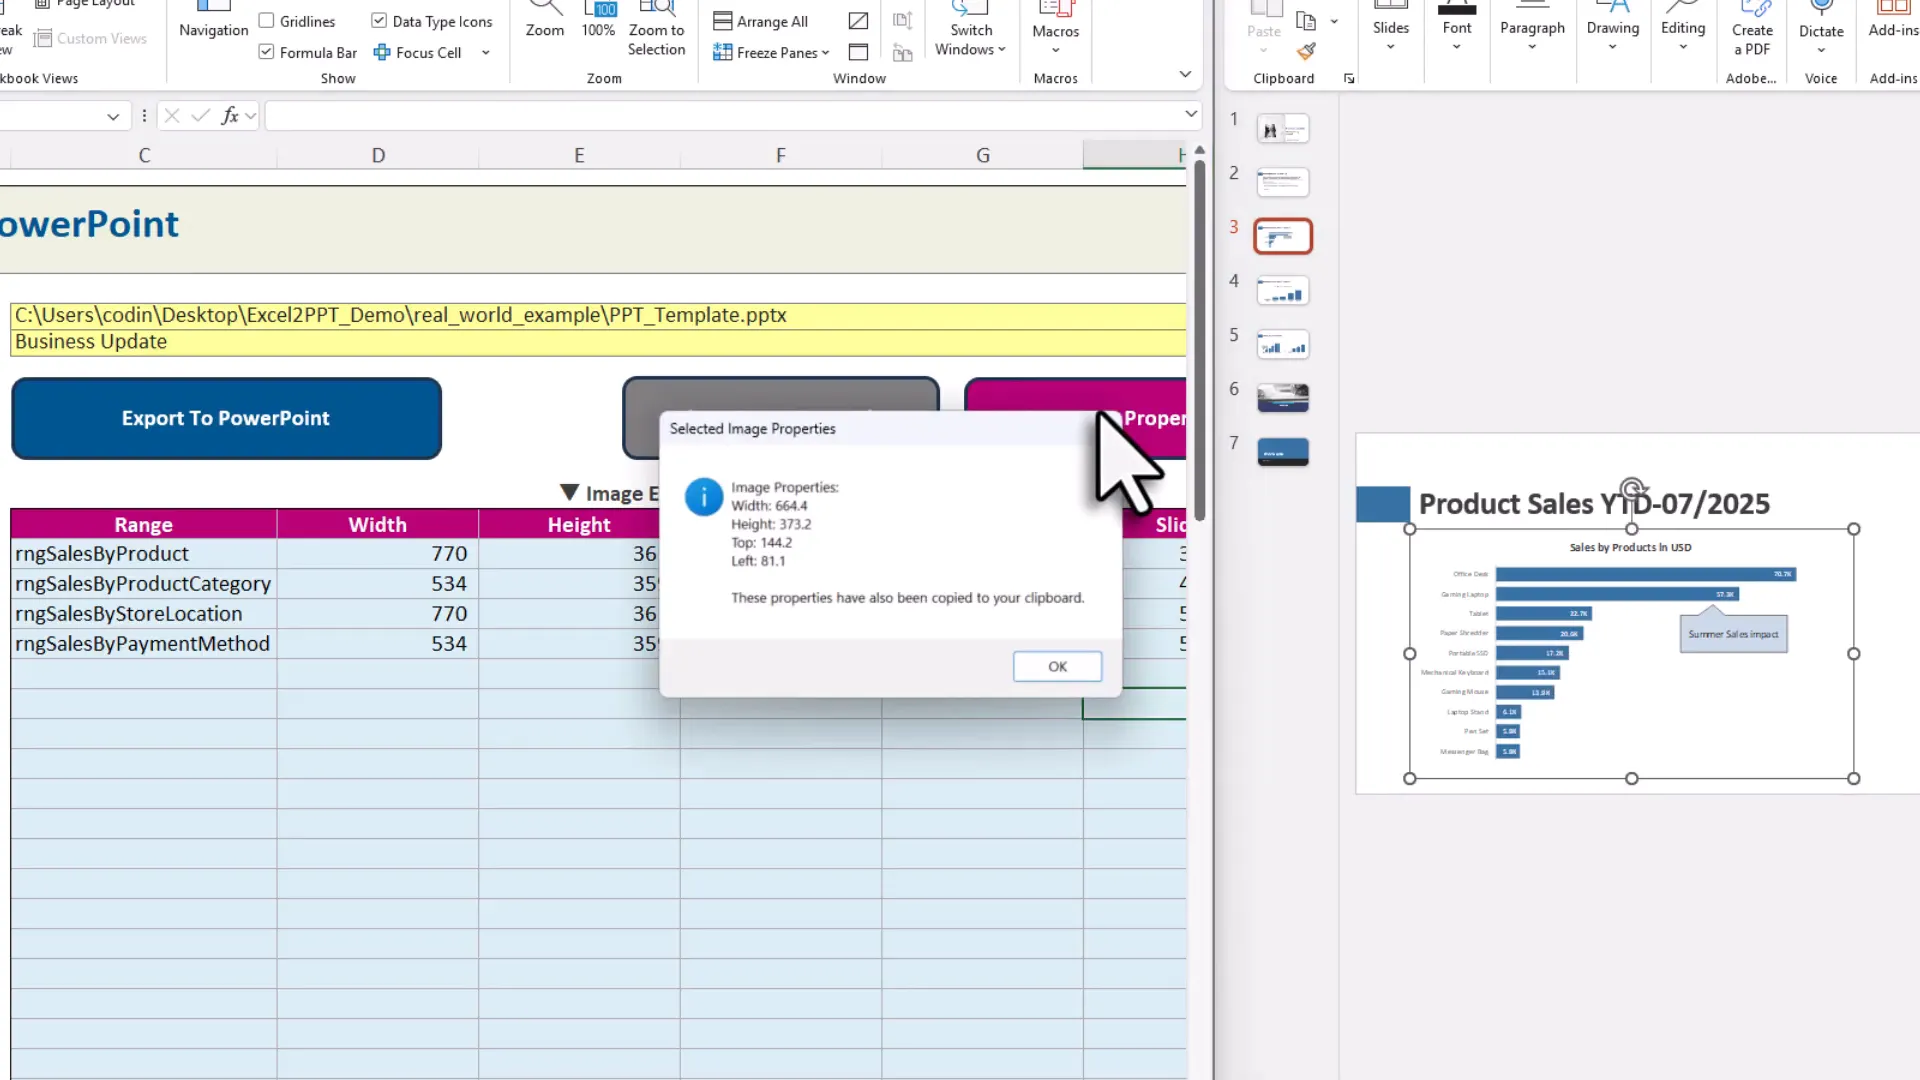
After the first export, you might want to adjust the size and position of your charts on each slide. This is a one-time setup task. To make future exports seamless, copy the image properties (like width and height) from PowerPoint back into Excel using the “Get Image Properties” button in the control panel.
This way, your VBA code knows exactly how to place each image every time you export.
Why Spend Time Setting Up?
Sure, the initial setup takes some time—naming ranges, mapping placeholders, adjusting slide layouts. (It’s a bit like assembling IKEA furniture; a bit of effort upfront saves you from wobbling chairs later.) But trust me, once your system is in place, generating monthly reports becomes a breeze.
Just refresh your data, update your comments, click export, and your presentation is ready to send out. No more late nights wrestling with PowerPoint formatting.
Ready to Automate Your Reporting?
If you’re ready to reclaim your time and make your reporting workflow more efficient, I’ve made this Excel VBA template available for you. You can download it and get started with a detailed getting started video that walks you through every step.
By automating PowerPoint using VBA, you’re not just saving time—you’re reducing errors, improving consistency, and making your life a lot easier. And hey, who doesn’t want to spend less time in front of a computer and more time enjoying a coffee break?
Grab the template here: https://pythonandvba.com/excel2ppt-exporter/
Final Thoughts
Automating the export of Excel charts and data into PowerPoint might sound intimidating at first, but once you break it down, it’s just a matter of setting up smart connections between your files. It’s like teaching PowerPoint to fetch your data for you—no more heavy lifting.
So next time you’re staring down a mountain of monthly reports, remember: with a little VBA magic, you can turn that mountain into a molehill. And if you ever want to chat about Excel, VBA, or just share your favorite coffee blend, you know where to find me.