Turn Excel Tables Into Stunning HTML Reports (Free Add-in)
Excel Tables To Web Apps: Turn Excel Tables Into Stunning HTML Reports
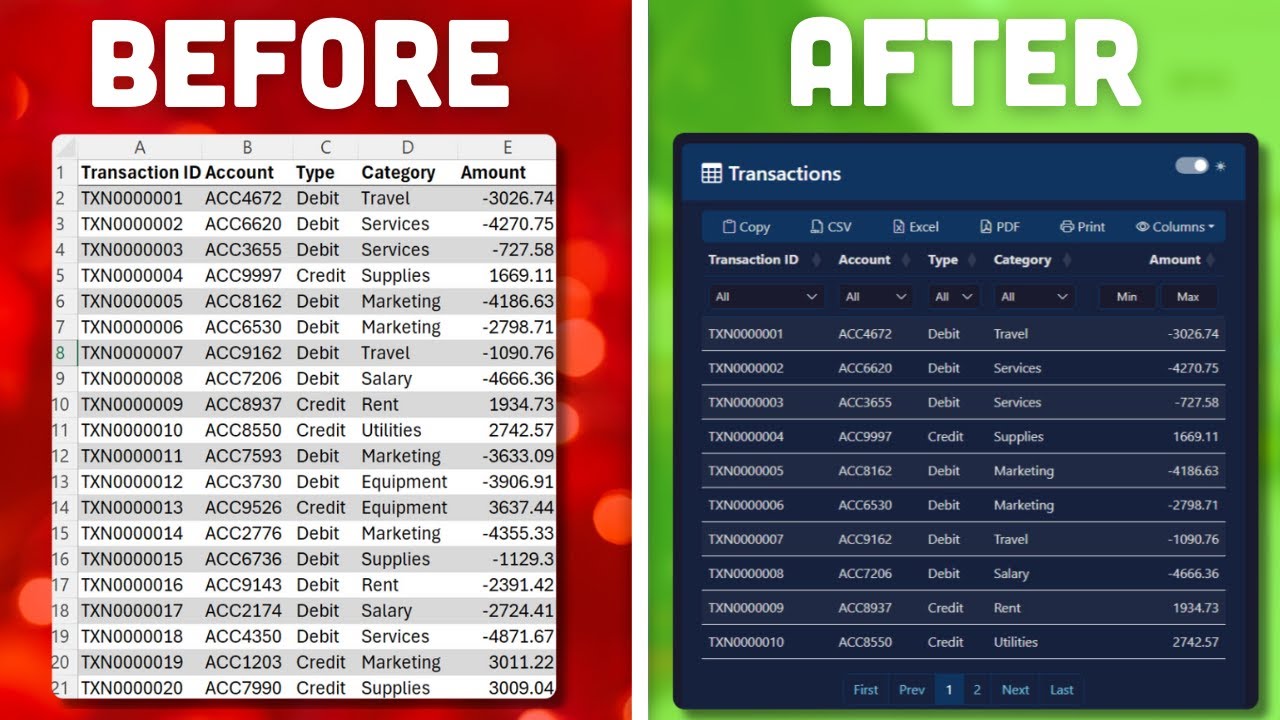
You email a spreadsheet, the recipient opens it and gets lost in endless rows and broken filters. What if the same data could be shared as a compact, searchable web page that anyone can open in a browser? That is the idea behind using an easy tool to convert Excel Tables To Web Apps so your data is clean, interactive, and simple to explore.
Why convert Excel tables to a web app-style report?
Spreadsheets are great for analysis, but they are poor at presentation. Sending a single HTML file instead of an .xlsx fixes several common problems at once:
- Faster navigation — built-in filters and search mean recipients find what they need without scrolling.
- Smaller files — the exported HTML is lightweight and easy to attach to an email.
- Privacy and offline use — everything runs locally so no data leaves the computer.
What the tool does (plain English)
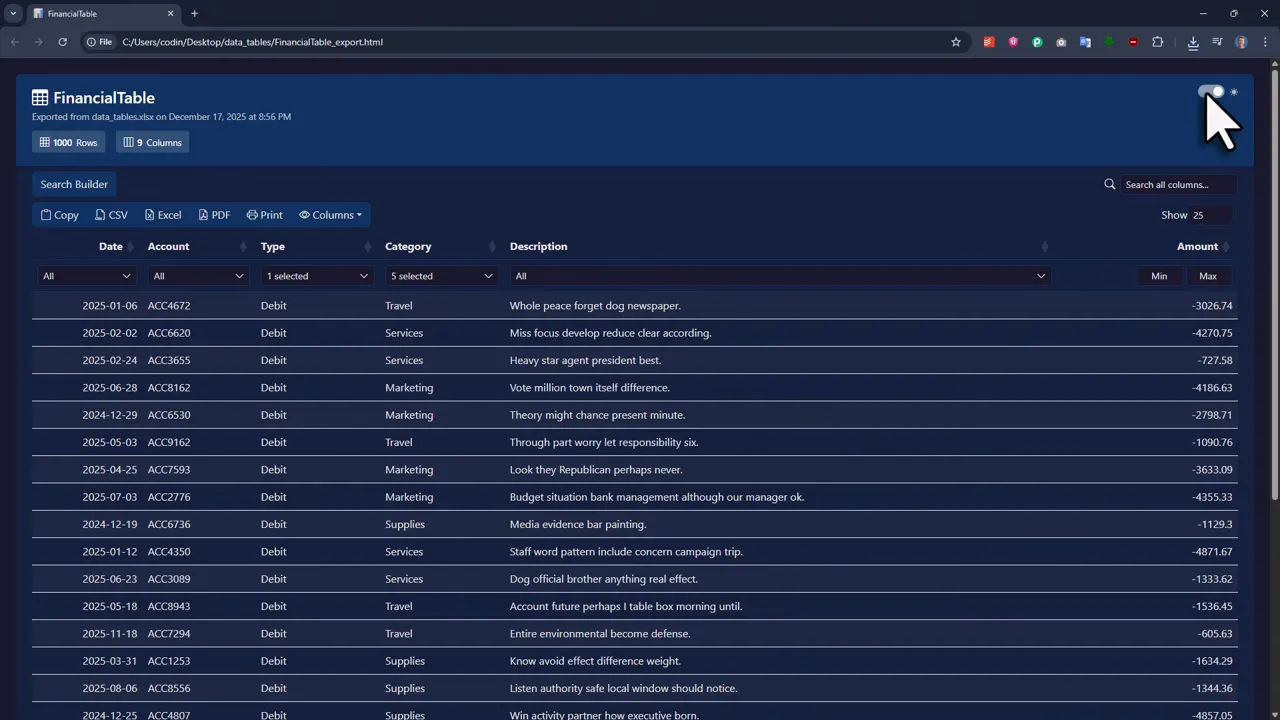
The core concept is simple: pick an Excel table, press a single button, and get a self-contained HTML file. That file displays the table with filter controls, column show/hide toggles, an advanced search builder, and export options for CSV, Excel, or PDF. Think of it as turning a static table into a mini web app that anyone can open instantly.
Quick walkthrough
Here is the typical flow when converting an Excel table to a web-style report.
- Create or select an Excel table (Ctrl + T to convert a range into a table).
- Use the add-in ribbon and click the Export to HTML button to choose a table to export.
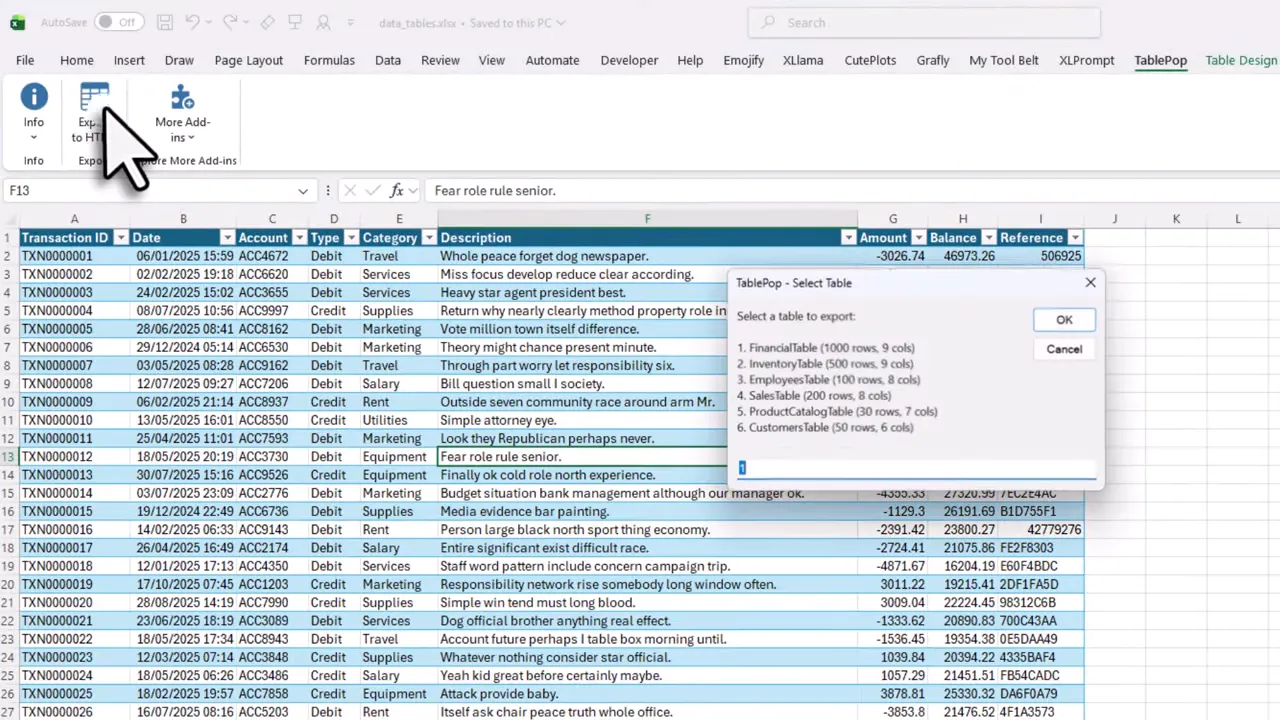
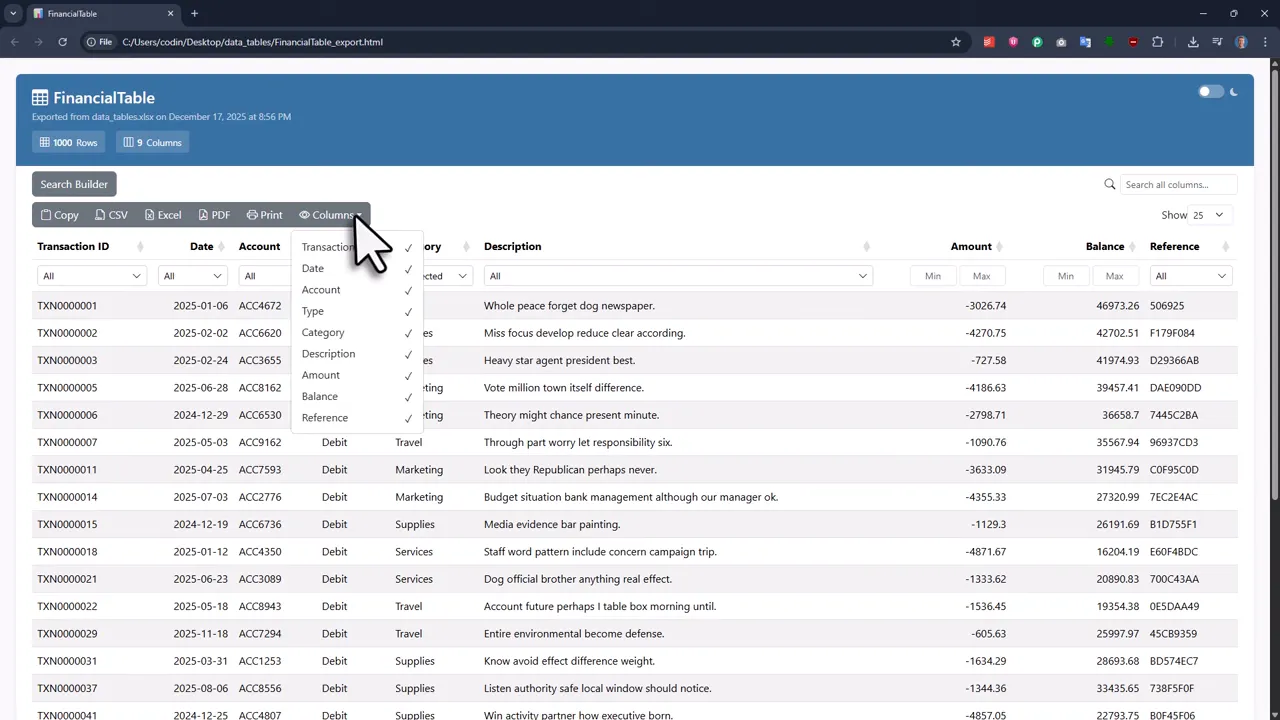
After export, a local HTML file is saved and can be opened in your default browser. The table renders with filters at the top and column visibility toggles so users can hide columns they do not need.
Advanced search and exports
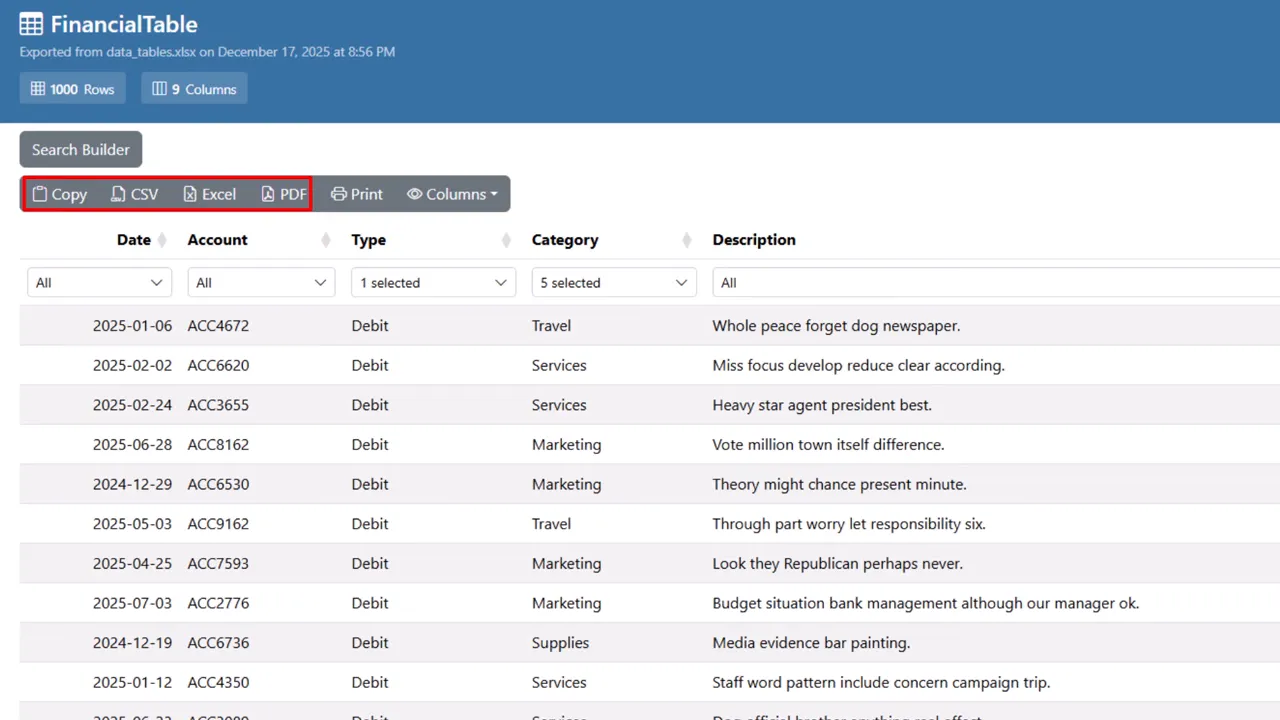
The search builder lets you chain multiple conditions (for example, sales greater than X and region equals Y). The results update live. When it is time to share or archive, recipients can export filtered results to PDF, Excel, or CSV, or copy data to the clipboard.
Nice-to-have features
- Select and export rows — highlight rows and export only the selection.
- Dark mode — a toggle for a darker UI that is easier on the eyes.
- Offline and tiny files — a 9-column, 1000-row example yields an HTML file around 140 KB.
Installing the add-in (step by step)
Installation is straightforward. Before you begin, extract the downloaded zip and, on Windows, unblock the add-in file via Properties if needed.
- Open Excel and go to File > Options > Add-ins.
- Click Go, then Browse to open the add-ins folder.
- Copy or drag the add-in into the folder, enable it, and click OK.
Free vs paid
The free version provides the full export and interaction features. The paid option removes a small branding link in the header and footer and unlocks dark mode. The paid option also provides a license key you paste into the add-in to remove the branding.
When to use this approach
Use Excel Tables To Web Apps when you need to share tidy, searchable data snapshots with colleagues, clients, or stakeholders who are not expected to edit the source workbook. It is ideal for internal reports, compact data handoffs, and anytime you want to avoid versioning headaches that come with shared spreadsheets.
Final takeaway
Converting Excel tables into lightweight, interactive HTML reports is a fast win. The output is professional, private, and easy to share. If you want quick, reliable ways to turn raw spreadsheet data into a polished, web-app-like experience, this approach delivers exactly that with minimal setup.
Happy exporting, and enjoy no more endless scrolling. (Yes, your recipients will thank you.) —Sven
Download the Excel add-in TablePop here: DOWNLOAD TABLEPOP