
Beautiful Charts From Your Excel Data, Live as You Type
Select your numbers, pick a chart, done. Chartmeister builds polished, interactive charts right in the Excel task pane, and the chart follows every edit you make. No chart wizard, no fiddling, no starting over.
- 18 chart types, from bar and line to waterfall, heatmap and KPI cards
- Send charts and dashboards anyone can open in a browser
- Your data never leaves Excel
Free for 7 days, no account; bar, line and pie stay free forever. Now available on Microsoft AppSource. Try the live demo below or add it to Excel.
| A | B | C | |
|---|---|---|---|
| 1 | Month | Product A | Product B |
| 2 | Jan | 120 | 90 |
| 3 | Feb | 135 | 95 |
| 4 | Mar | 148 | 121 |
| 5 | Apr | 162 | 118 |
A cell changes, the chart follows. That is the whole idea.
This is your Excel data. This is your chart.
Type over any number in the sheet below and watch the chart follow. Then click through all 18 chart types, drawn by the same chart engine the add-in ships.
Sheet1 sample
Every cell is editable, labels included. In Excel you would just select this range and press Use selection.
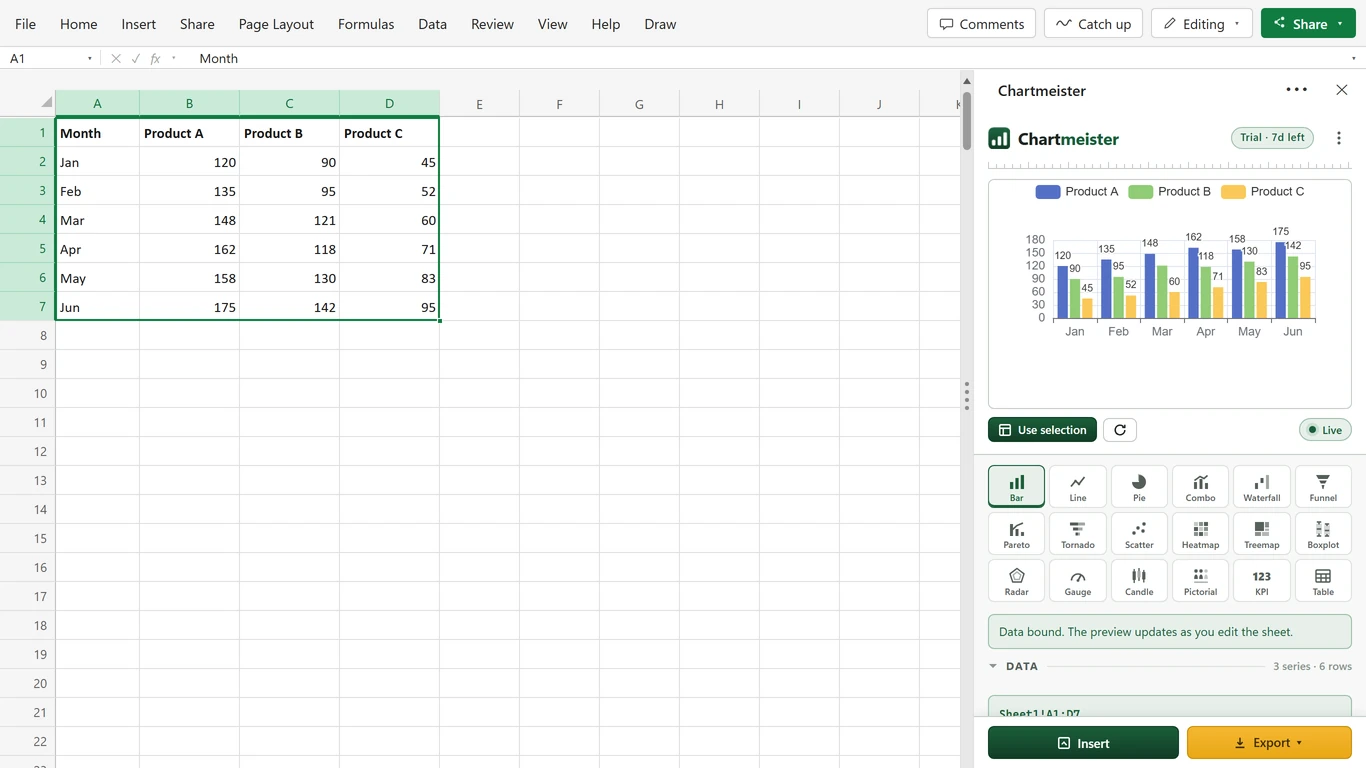
The live demo needs JavaScript. This is the add-in doing the same job in Excel.
Every tile is drawn live, right on this page. Click one to load it into the demo above, then edit the numbers.
How it works
Three steps, and the first chart takes about a minute.
Select your data
Headers included, straight in the sheet. Or press "Try it with sample data" and skip even that. Single cell? It expands to the block around it.
Press Use selection
A live chart appears in the pane. Headers, label column and orientation are detected for you, and from now on the chart follows every edit you make.
Insert, export or share
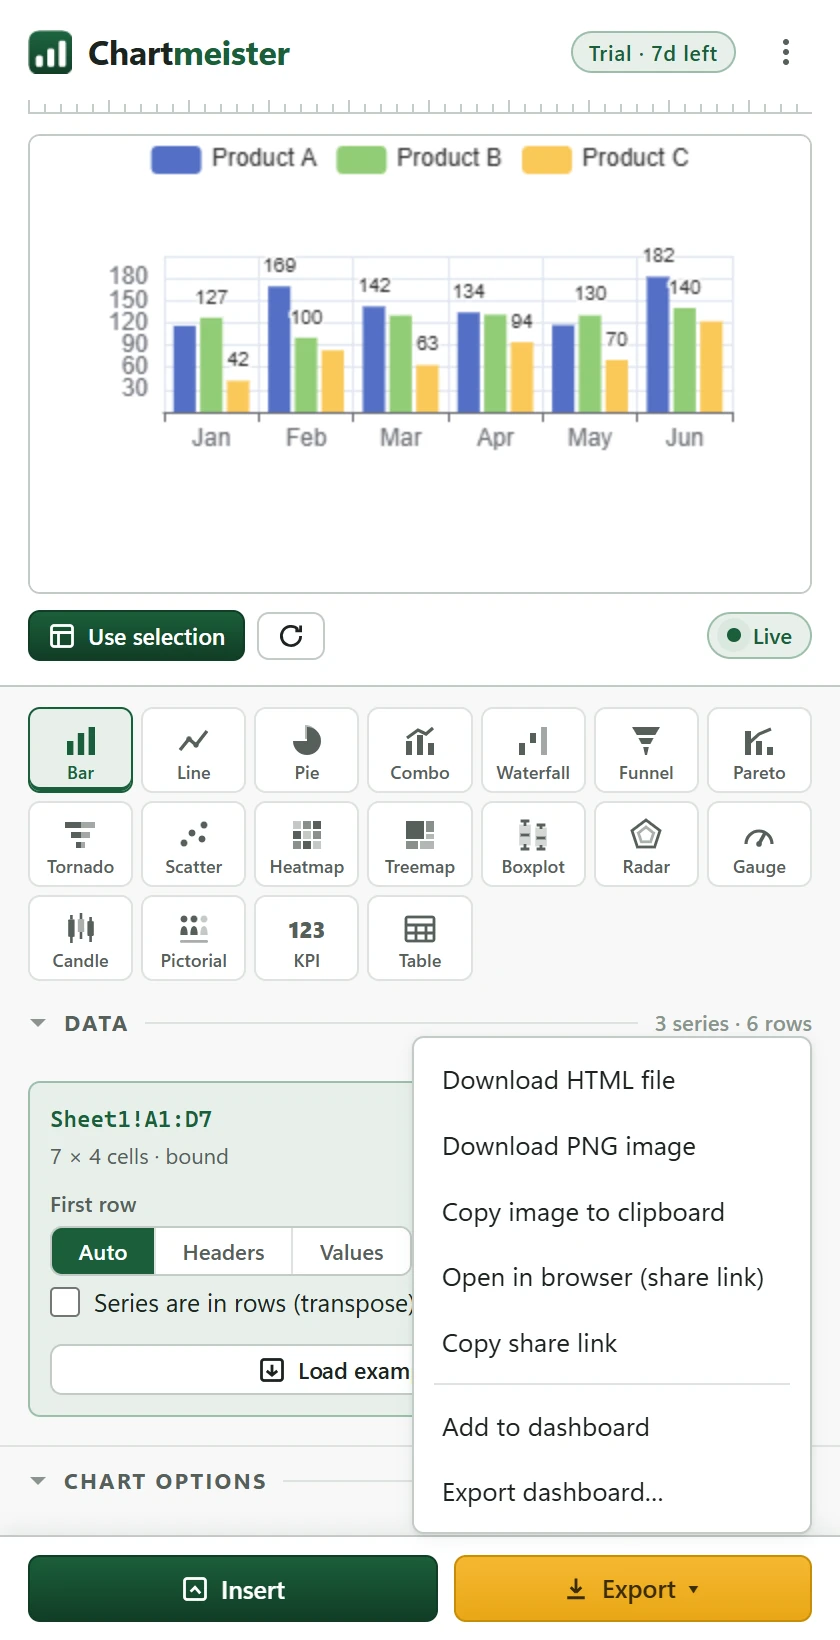
Put it in the worksheet with one click, download it as an interactive page or image, send it as a link, or collect several into a dashboard.
Made for ad-hoc analysis
The question is on the table and the numbers are already in your sheet. These are the moments Chartmeister was built for.
The quick question from your boss
"How did the regions do last month?" The numbers are in your sheet, so select them, pick a chart, and copy the image into your reply, or paste a share link into the chat. About a minute, start to send.
Charts for people who only have a browser
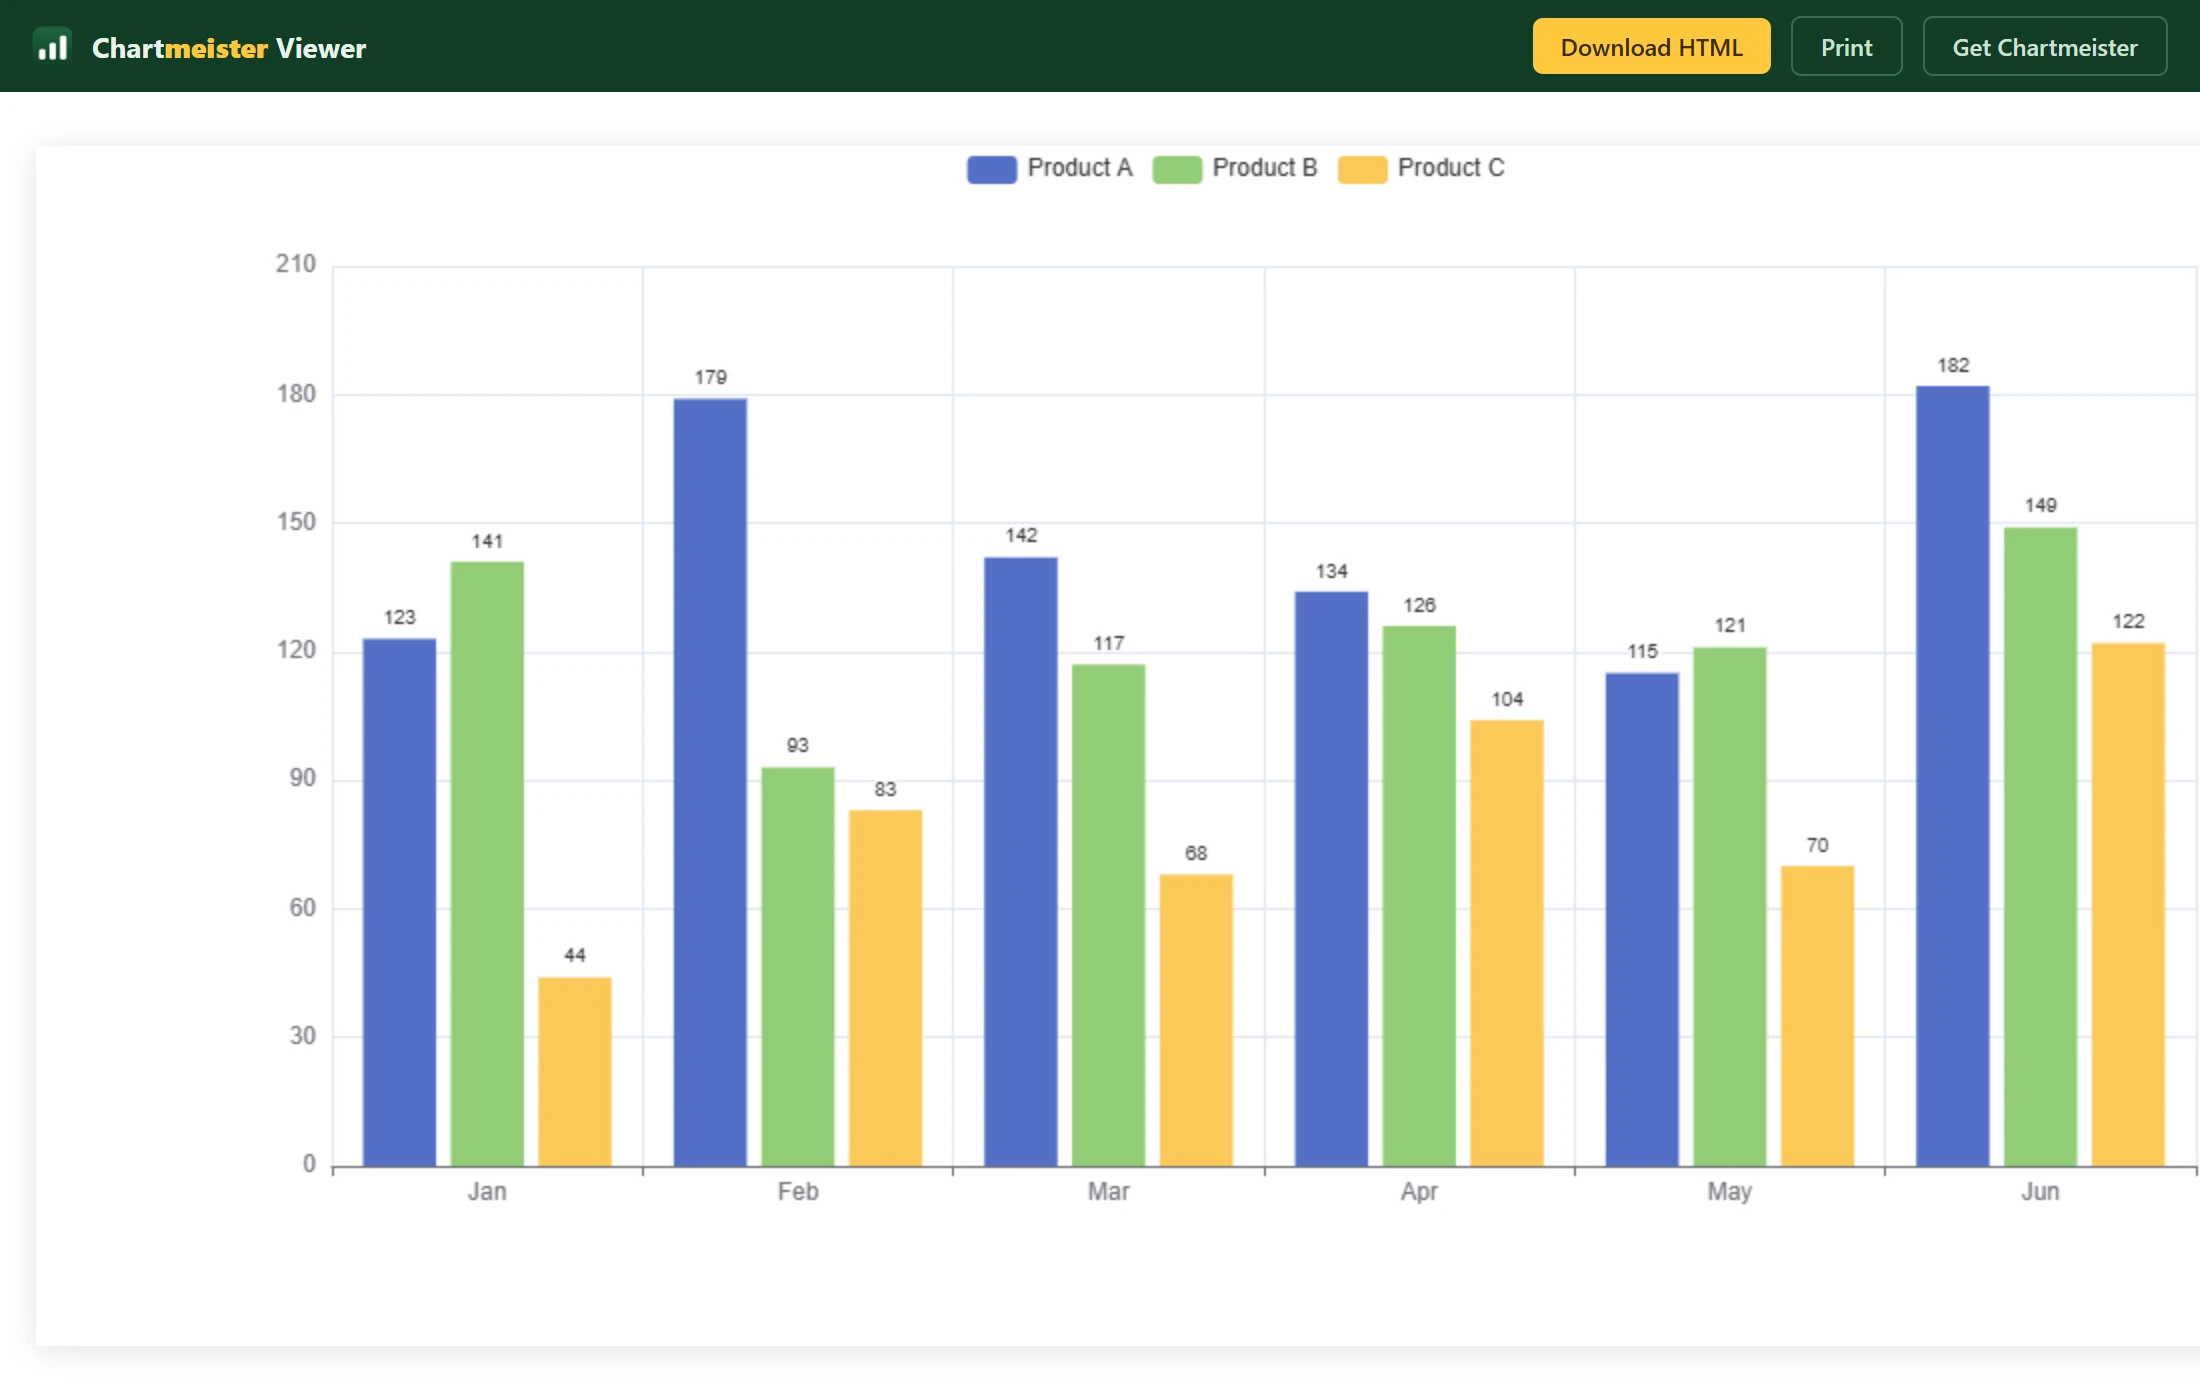
Every chart exports as one small HTML file. Email it to a client, drop it in Teams, put it on the shared drive: it opens in any browser, works offline, and keeps its tooltips. Nobody needs Excel, an account, or the add-in to see it.
A one-page dashboard for the team
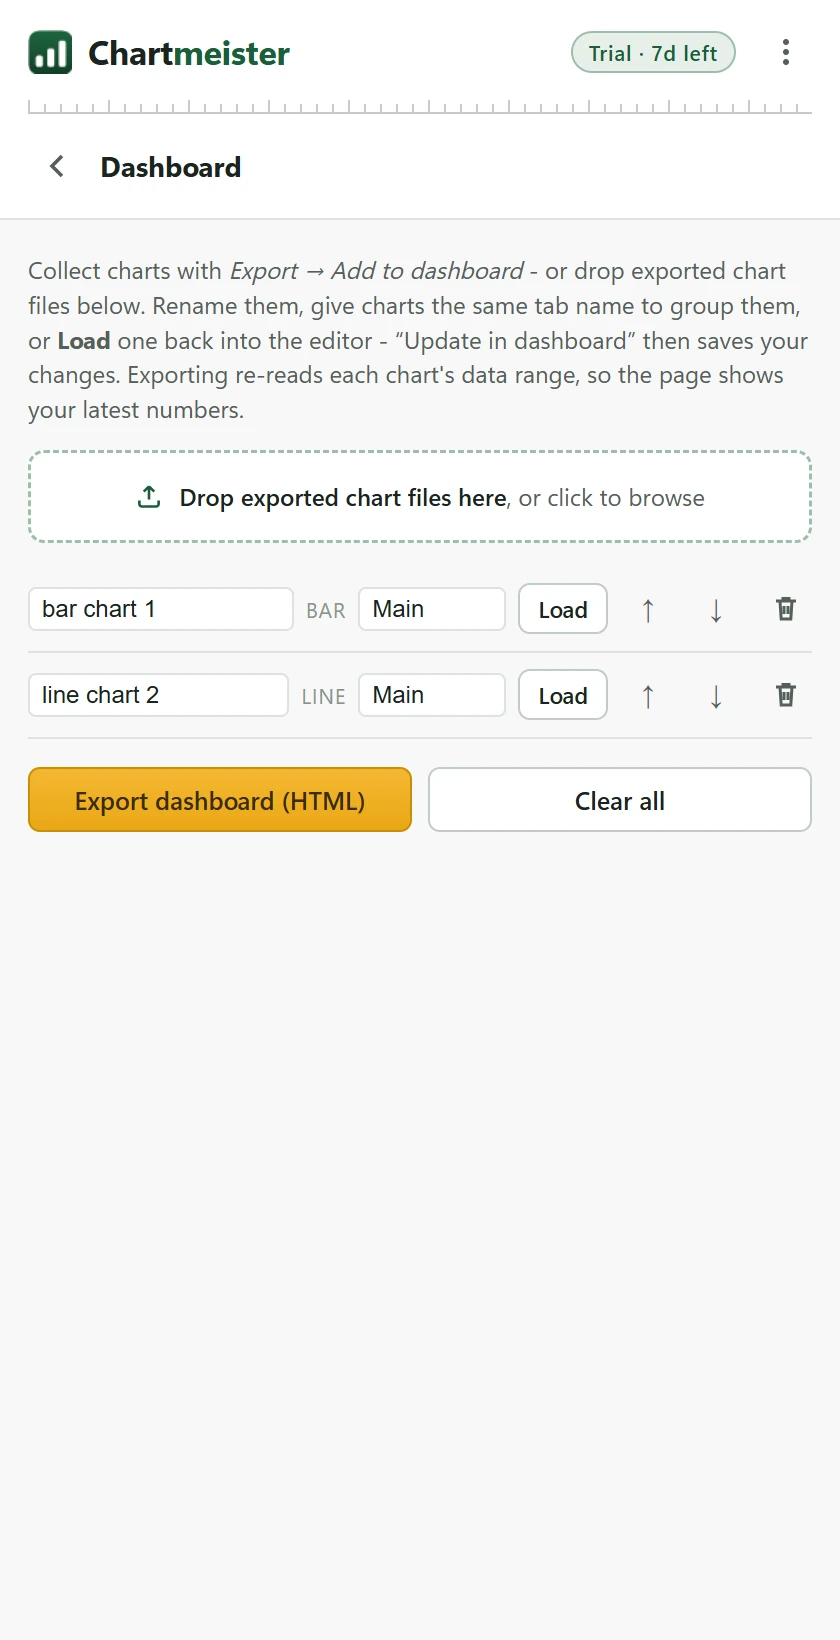
Collect charts as you work, group them into tabs, and export a single page with draggable cards. A weekly team page or a month-end overview, without a data model, a gateway, or per-viewer licenses. Click around a live one right below.
The report that comes back every week
Next week's numbers land in the same range and the charts simply rebind. Inserted pictures update in place, dashboards re-read every range on export, and your templates and brand kit keep the look identical. Five minutes, most weeks.
Turn your charts into an entire dashboard
Collect your charts, group them into tabs, and export one HTML page, like this one. It is live: drag the cards, resize them, switch tabs.
Every card is a live chart: hover for tooltips, drag them around, resize them, switch tabs. The exported file also remembers the layout you arrange and re-reads your latest numbers on every export.
Excel charts, Power BI, or Chartmeister?
All three have their day. Excel's own charts live next to their data, Power BI is a platform you roll out, and Chartmeister turns the sheet in front of you into something you can send.
| Excel's built-in charts | Power BI | Chartmeister | |
|---|---|---|---|
| Your first chart | Two clicks, right on the sheet | Install the desktop app, connect data, build a model | Select cells, press Use selection |
| Making it look good | Manual fiddling, every single time | Polished, once it is built | Polished out of the box; 14 themes and your brand kit |
| Chart types | The classics; gauges, KPI cards and heatmaps take workarounds | Everything, through custom visuals | 18 types in one row of buttons |
| Once it leaves Excel | A static picture, or you send the whole workbook | A link into the service; viewers sign in, usually with a license | An interactive file or link; tooltips keep working in any browser |
| Dashboards | Arranged by hand on a sheet | Its whole job, after the setup | Tabs and cards, exported as one page |
| Price | Included with Excel | Per person, per month | Free tier; paid plans from $69 once |
| Built for | A chart that stays next to its data | Company-wide reporting on many sources | The chart you need to send today |
The chart is just the start
What you do with it is the good part.
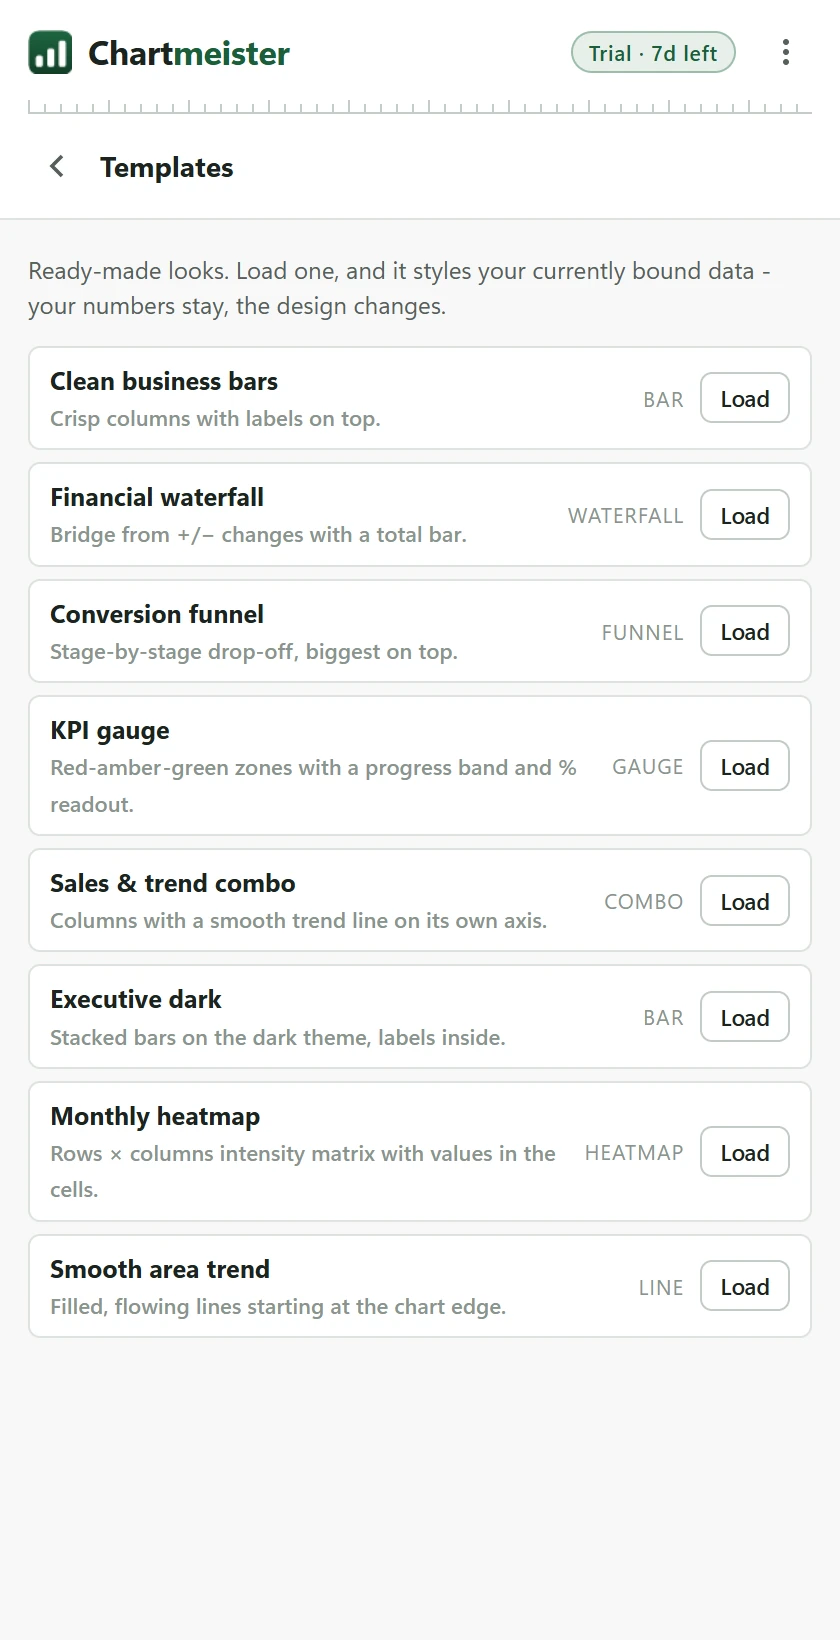
- Charts inherit the number formats of your cells, so currencies and percentages come out right
- Headers, label column and orientation are detected automatically, with manual overrides
- Handles up to 10,000 rows and 30 series in one chart
- Each chart type remembers your last options, and presets save whole setups
- Averages, min and max markers, stacking, zoom slider and a second axis when you need them
- The pane itself has a dark mode and follows Excel's look
Your numbers never leave Excel
Most chart tools are websites: you upload your spreadsheet and hope. Chartmeister ships its chart engine inside the add-in, so every chart is built locally, in your Excel, on your machine.
That is not a promise buried in a policy. It is how the thing is built.
Pay once, no subscription
Everything is free for 7 days, no account. Bar, line and pie stay free forever. Both paid plans unlock all 18 chart types. Choose a plan for yourself or your team.
- Bar, line and pie charts, free for good
- All 18 types free for the first 7 days
- Live preview, insert, exports, share links and dashboards included
- Exports carry a small "Made with Chartmeister" mark after the trial
- 1 user, up to 3 devices
- All 18 chart types, unlocked for good
- No watermark on anything you export
- Every future update included
- One payment. No subscription, no account.
- Up to 15 users
- All 18 chart types, unlocked for good
- No watermark on anything you export
- Every future update included
- One payment. No subscription, no account.
14-day refund, no questions asked. If it is not for you, email me and you get your money back.
- Excel on Windows
- Excel on Mac
- Excel on the web
- Microsoft 365 or Office 2021 and later
Frequently asked questions

Still have a question?
I’m Sven, the developer, and I usually reply within a day.
Ready when your next chart is
Install it from AppSource, press Use selection, and your first live chart is on screen in under a minute.
Add Chartmeister to ExcelFree for 7 days, no account. Paid plans from $69 once, with a 14-day refund.
Chartmeister is made by Sven Bosau and published by Bosau Digital LLC. Privacy policy · Terms of use · Refund policy
