
Skip to content

Easy variance analysis and professional charts in Excel

Select your table and pick a chart: budget against actual, bridges and P&L variance tables in IBCS notation, linked to your data.

Every chart type free for 14 days. No account, no card.

Try it right here

Change a number or pick another chart.
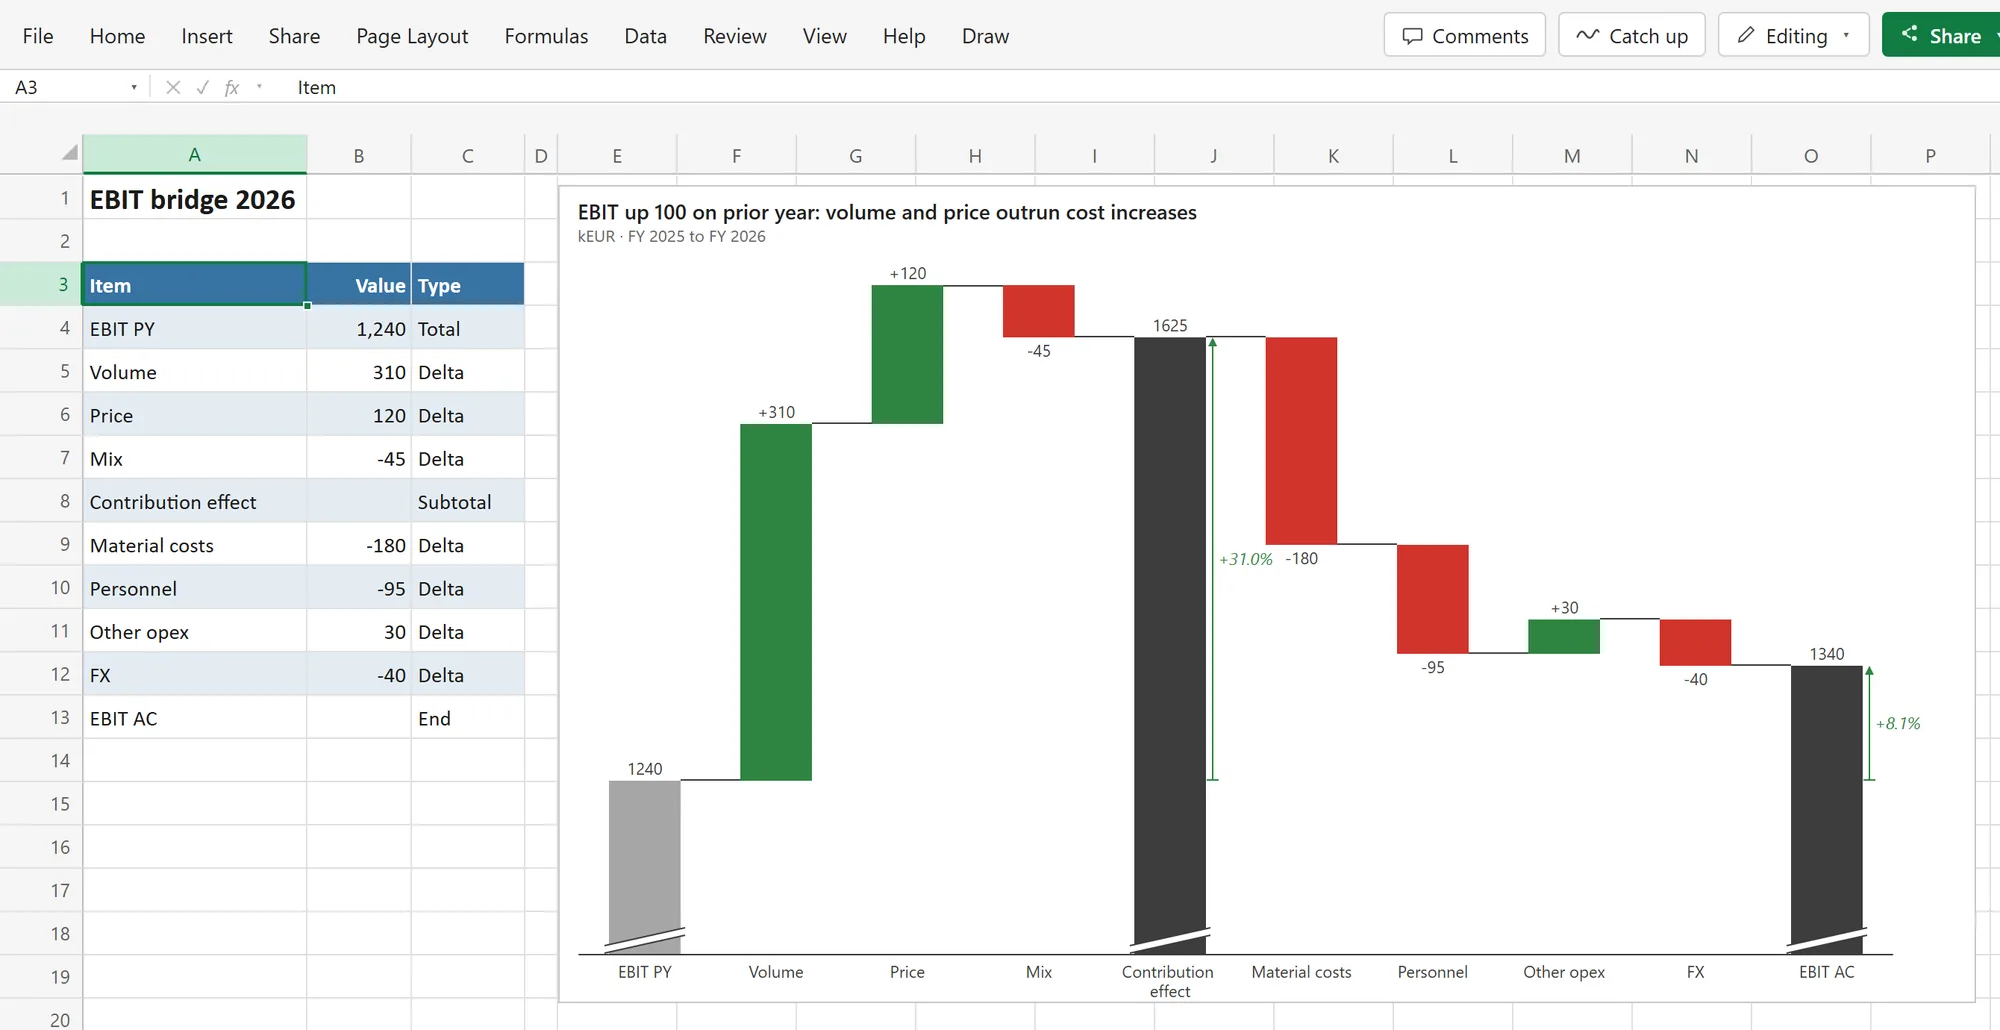
Excel with an EBIT bridge table in A3:C13 (Item, Value, Type) and the Deltaline bridge chart next to it: EBIT PY 1240, volume +310, price +120, mix -45, contribution effect 1625, material costs -180, personnel -95, other opex +30, FX -40, EBIT AC 1340.

Variance charts and the business classics

Everything your monthly report needs.

How it works

Pick a chart for your table

Click a cell in your table and insert Deltaline from the Add-ins menu on the Home tab. It reads the table and marks the best fit as Suggested.
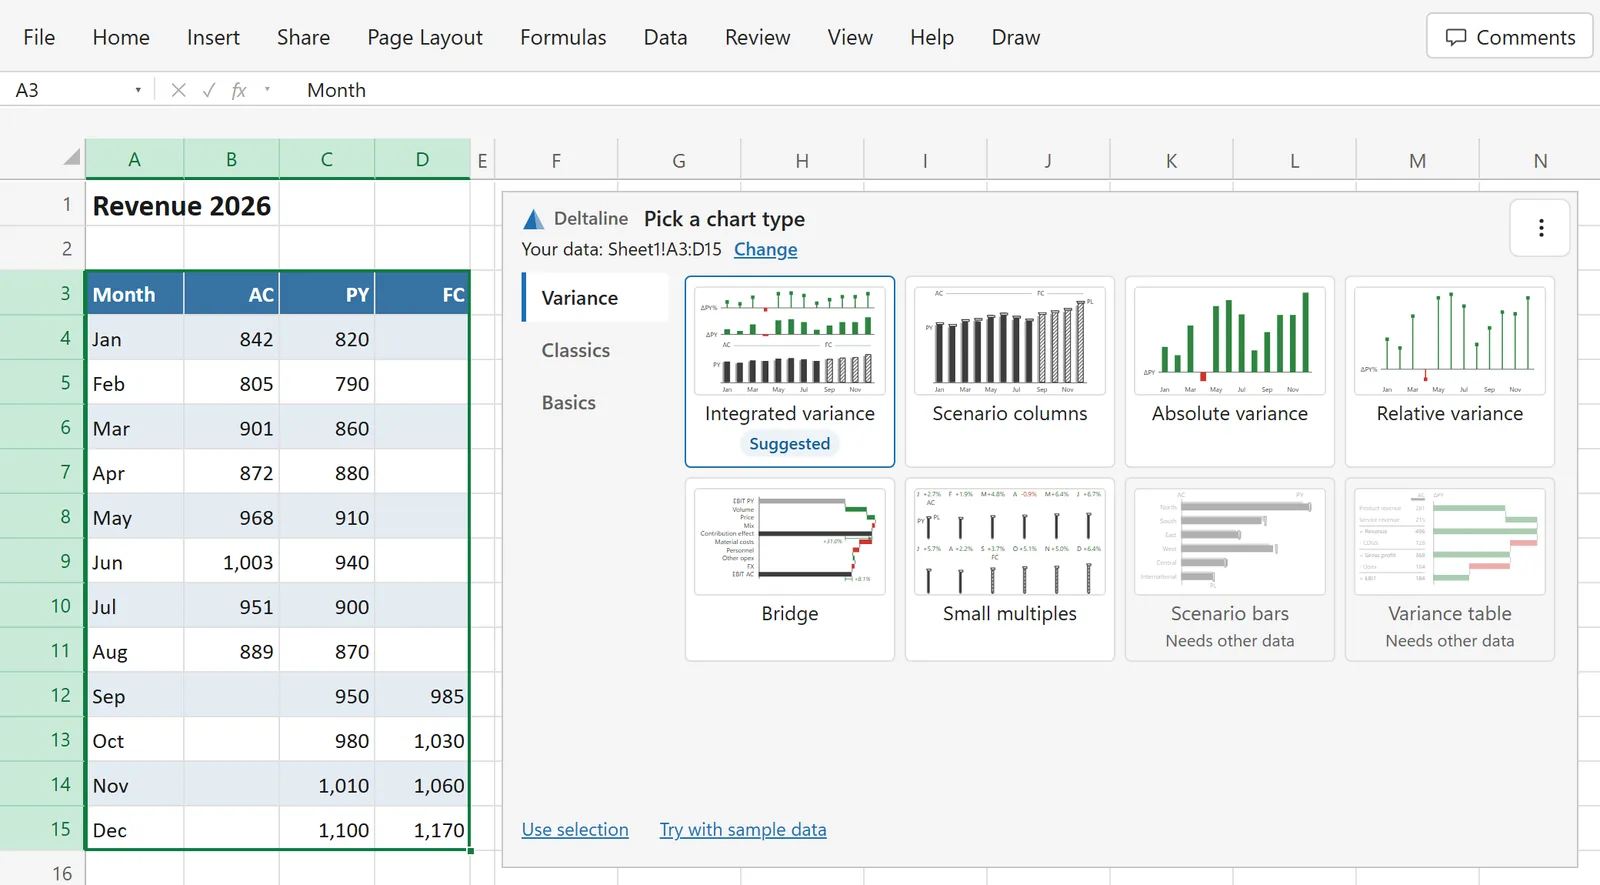
A revenue table in A3:D15 is selected. Next to it the Deltaline frame reads Pick a chart type, Your data: Sheet1!A3:D15, and shows the variance chart types as pictures, with Integrated variance marked Suggested.

The chart sits next to your data

It is linked to the table, not pasted. Type your message as the title. Actual, prior year, plan and forecast always look the same.
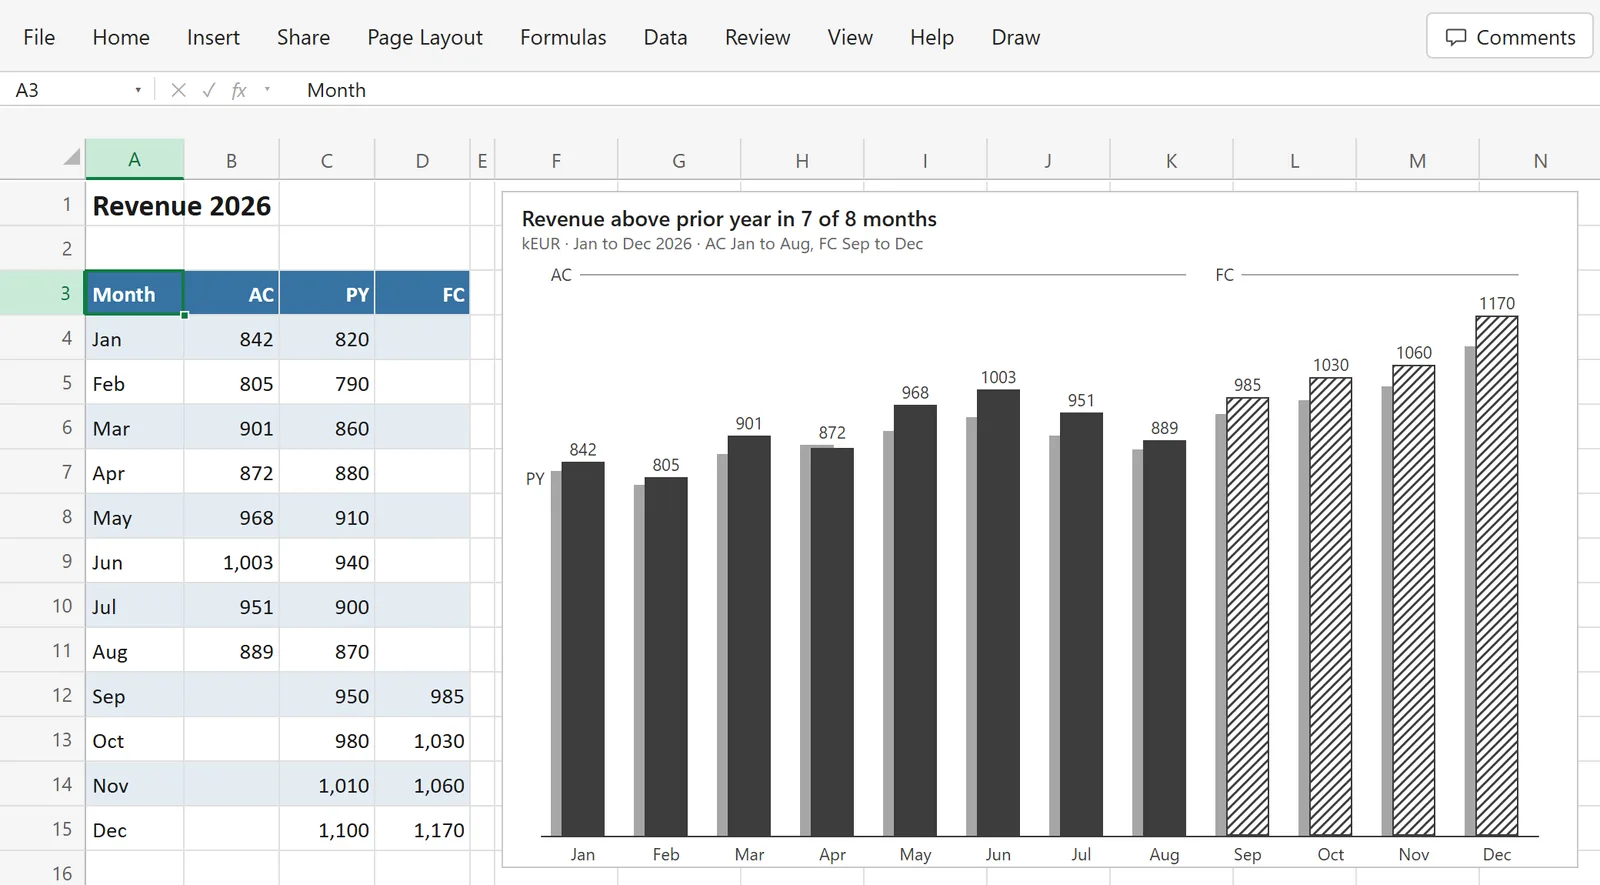
The revenue table with a Scenario columns chart next to it titled Revenue above prior year in 7 of 8 months: actual as dark columns, prior year grey behind, forecast hatched. July actual is 951.

Change a number, the chart redraws

Here July went from 951 to 1,080. No refresh, no copy and paste. Save the workbook and the charts are still live next time.
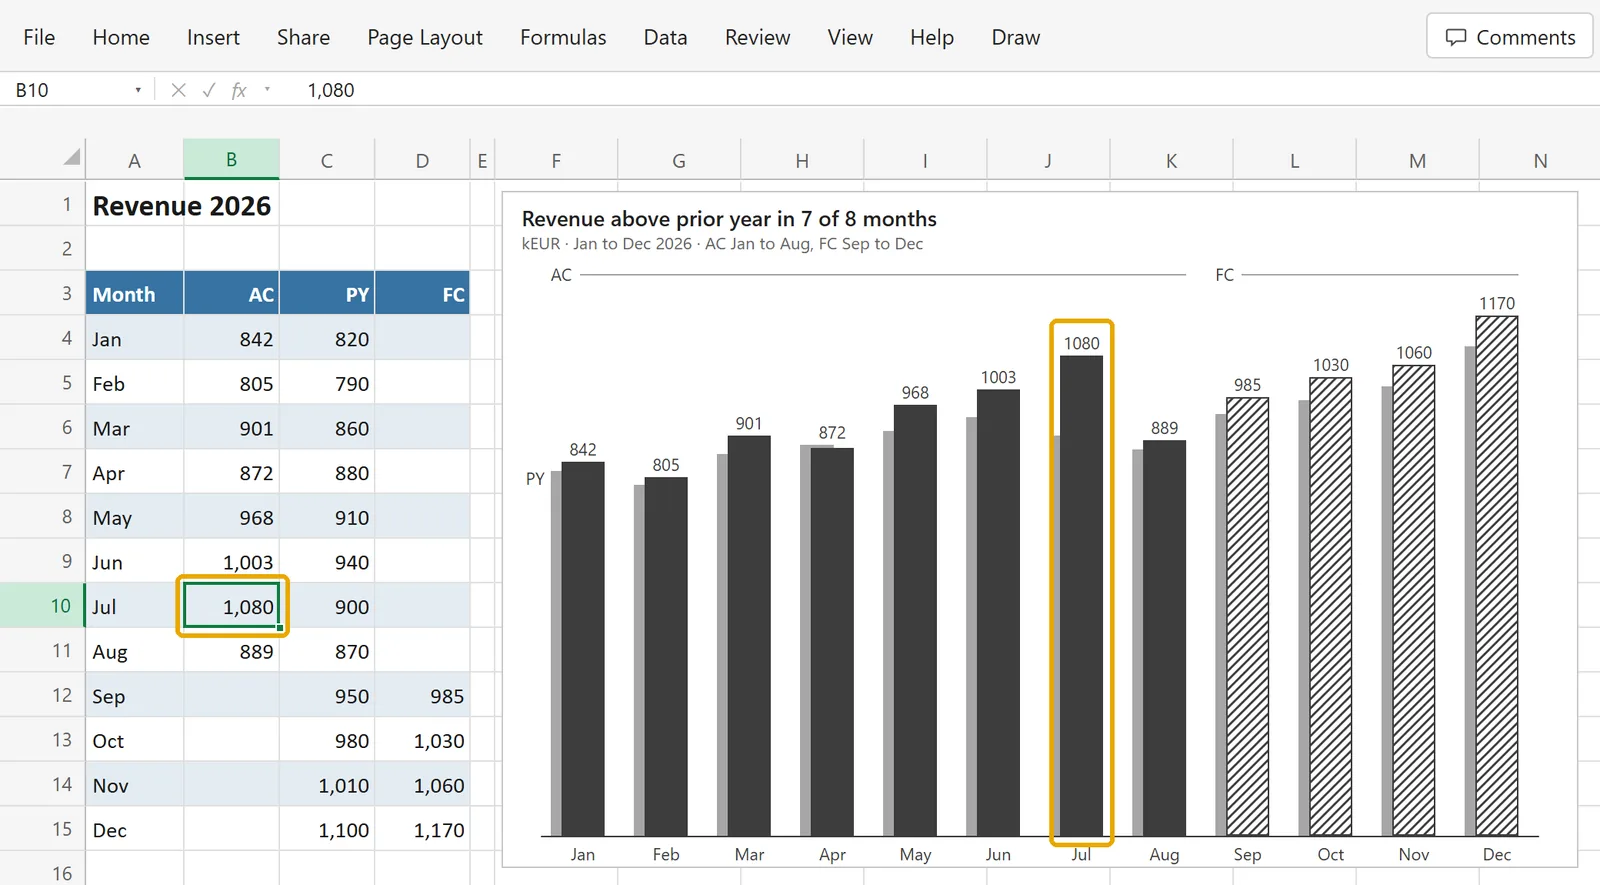
The same sheet after cell B10 was changed to 1,080: the July column in the chart now reads 1080 and is the tallest actual column.

Viewers need no license

Colleagues open the workbook and see live charts. They only need the free add-in, which they add from Microsoft Marketplace or IT deploys for everyone.

Your numbers never leave Excel

Every chart is drawn on your device. Deltaline uploads no workbook data. Privacy policy

Pay once. No subscription.

Every chart type is free for 14 days. After that, column, bar, line, pie and Scenario columns stay free with a small "Made with Deltaline" badge.

Free
$0
no account
  • Every chart type for the first 14 days
  • Then column, bar, line, pie and Scenario columns, free for good
  • Live charts and exports included
  • A small "Made with Deltaline" badge on free charts
Get it on Microsoft Marketplace
Lifetime license
Single User
$149
one payment
  • 1 user, up to 3 devices
  • All 23 chart types
  • No badge, for anyone who views your charts
  • Future updates included
Get Single User
Lifetime license
Team
$449
one payment
  • For your team, up to 15 devices
  • All 23 chart types
  • No badge, for anyone who views your charts
  • Future updates included
Get Team

No questions asked.Not happy with Deltaline? Email me within 14 days of your purchase and I’ll give you a full refund.
Sven, Deltaline developer

  • Excel on Windows
  • Excel on Mac
  • Excel on the web

Frequently asked questions

Excel on Windows or Mac with Microsoft 365 or Office 2021 and later, or Excel on the web. You add Deltaline from Microsoft Marketplace; there is no installer to download.
No. Anyone who opens the workbook with the free Deltaline add-in sees the charts, and they stay live. Only building or editing charts beyond the free types needs a license or the trial.
Nothing breaks. Column, bar, line, pie and Scenario columns stay free, with a small "Made with Deltaline" badge. Charts you made during the trial keep working and updating. A license unlocks every chart type and removes the badge.
No. Every chart is drawn inside Excel on your device, and nothing sends workbook data anywhere. When you edit a chart, Deltaline checks your license with the key, a random install ID and the app version. Viewers make no license check. Details are in the privacy policy.
Yes. The Export menu saves a PNG, copies the chart as an image, downloads an HTML page or copies a share link. A share link carries the chart inside the link itself, so nothing is uploaded; anyone you give it to can see the numbers in it.
Checkout is by card or PayPal. If your company needs an invoice or a purchase order first, contact support. After a purchase, your invoice is in your account at account.pythonandvba.com.
Single User covers one person on up to 3 devices. Team covers up to 15 devices. Removing the key from a device frees its place.
Yes. Save your brand colors once and use them in the classics and basics. Variance charts keep their scenario notation, so actual, plan and forecast always read the same.
It reads your column headers: Actual, Budget, Plan, Prior year, Forecast and the short forms AC, PY, PL, BU and FC (German names work too). You can change the mapping in the chart editor.
Yes. Link a chart to an Excel table and it follows new rows as the table grows, including a table loaded by Power Query.
Yes. Use Copy image in the chart's Export menu and paste it into a slide, or download a PNG.
Yes, within 14 days of purchase. Email me and you get your money back, no questions asked.
Sven Bosau

Still have a question?

I’m Sven, the developer, and I usually reply within a day.

Please enter your first name.

Please enter a valid email address.

Please write a little more (at least 10 characters).

Your email is only used to reply. No newsletter.

Try it on this month's report

Add Deltaline, click a cell in your table and pick a chart. Every chart type is free for 14 days.

Get it on Microsoft Marketplace

Desktop apps, Excel add-ins, and free tools for everyday work.

Stay Updated

Get new tool updates and exclusive deals.