
How to use Polars in Excel for FREE (Quick & Easy)

Polars runs inside Excel through xlwings Lite, with no Python installed on the machine. Enable Polars in the add-in requirements, then write functions that take a range and return a DataFrame. Two examples follow: a top-product-by-region lookup and a longer script.
What you need
- A recent Excel for Windows or Excel for the web.
- The free xlwings lite add-in.
Why use Polars in Excel
Polars is a fast DataFrame library for Python. Using Polars in Excel gives you powerful, columnar data operations combined with the familiarity of a spreadsheet. You get speed and concise code without a local Python setup.
Install xlwings lite and enable Polars
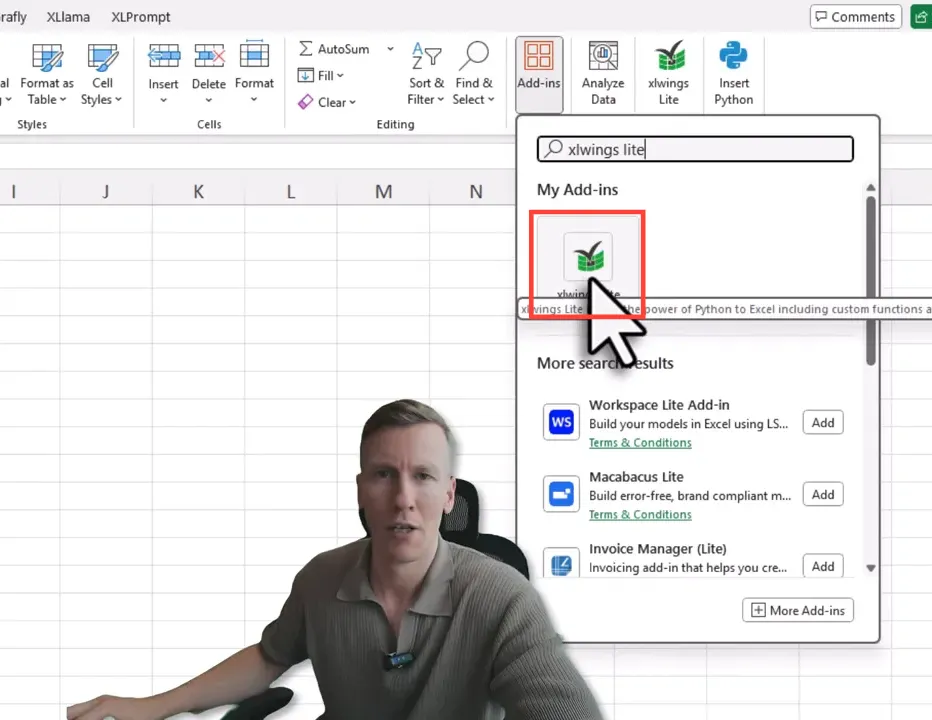
- Open Excel and go to the Home tab, then click Add-ins.
- Search for “Excel Wings Lite” or “xlwings lite” and add the add-in.
- Open the add-in panel (it usually opens automatically after install).
- Go to the Requirements or Dependencies tab inside the add-in.
- Add “polars” as a dependency and reload the add-in when prompted.
That’s it. You don’t need to install Python on your machine. xlwings lite uses Pyodide (Python compiled to WebAssembly) and runs in a sandbox in your browser. You can now write Python code directly inside Excel and import Polars. 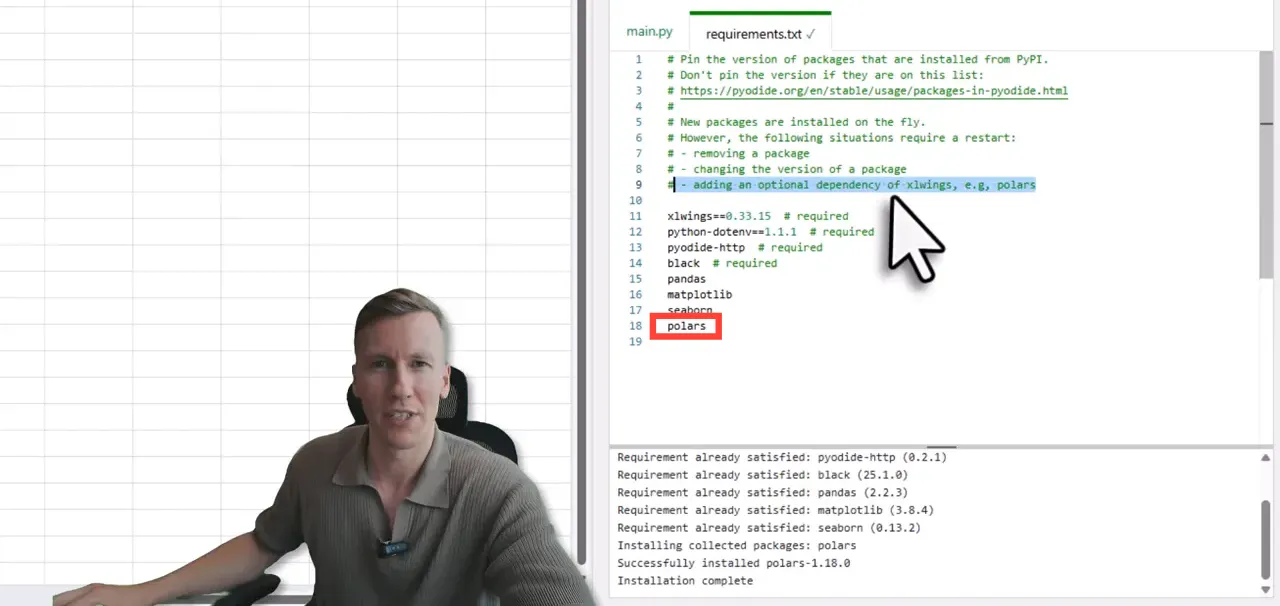
Example 1, A simple function: top product by region
I created an Excel function that accepts a Polars DataFrame and returns revenue by region. The idea is simple:
- Read the Excel table into a Polars DataFrame.
- Create a new column revenue = units_sold * unit_price.
- Group by region and sum the revenue.
- Sort the result by total revenue in descending order.
- Return the result to the worksheet.
In xlwings lite you can register a Python function as an Excel lambda using a decorator. Once registered, the function appears like a built-in worksheet function. Select your data range, call the function, and it returns a neat summary table. This is a practical way to use Polars in Excel for quick aggregations and summaries. 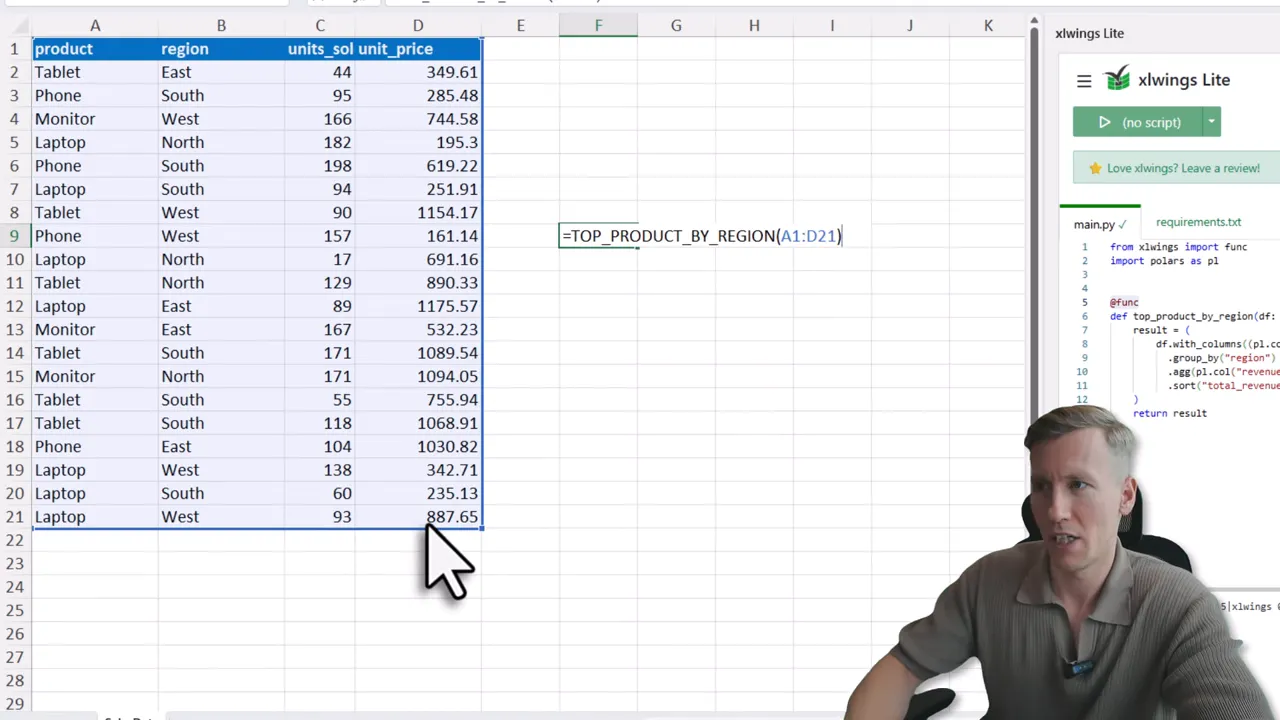
Example 2, Script to create a summary sheet and chart
If you want more than a single function, use a script decorator to add a clickable button in the add-in. My script does the following:
- Read the sales table from the “Sales Data” sheet into a Polars DataFrame.
- Compute revenue and aggregate by product.
- Create or clear a “Summary” sheet.
- Write a title and insert the aggregated table (styled as needed).
- Generate a chart with matplotlib and paste it back into the workbook as an image.
The whole flow fits in a few dozen lines. The key is that xlwings lite understands how to convert Excel ranges to Polars DataFrames and back, so you can use Polars in Excel to do the heavy lifting and then write results and charts back into the workbook. 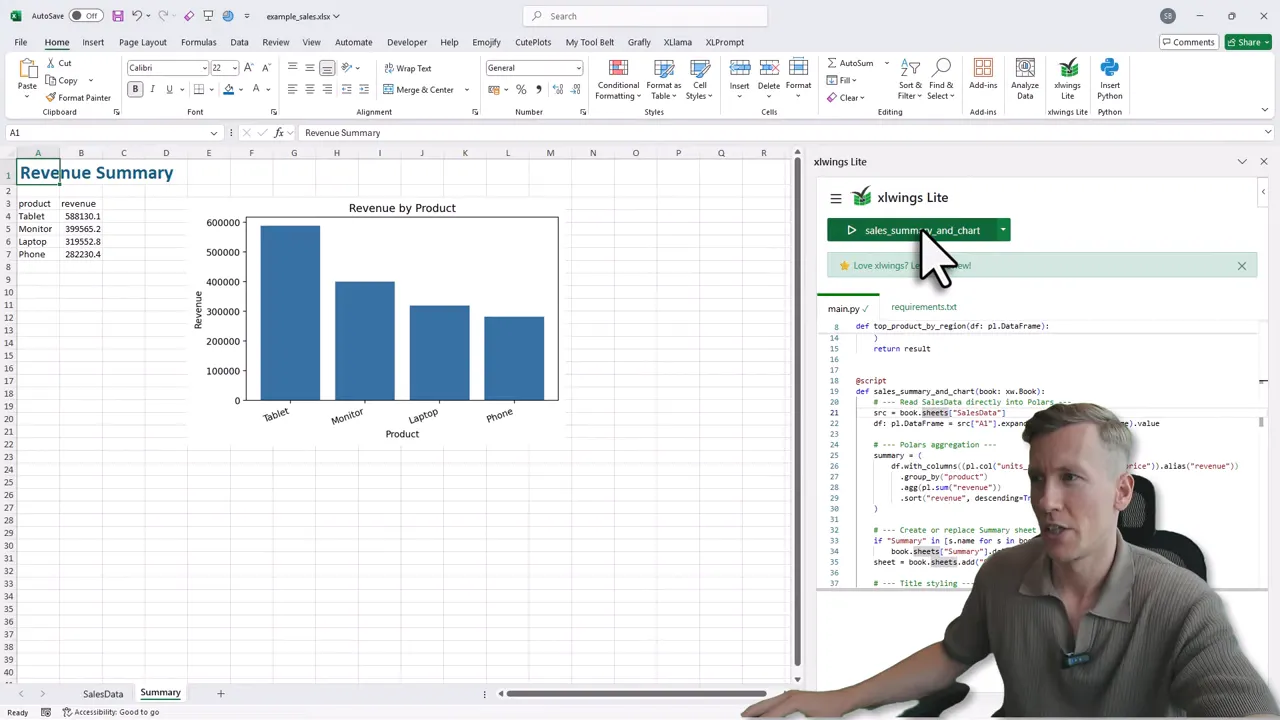
Quick tips
- If you see an import error for polars, add the dependency and reload the add-in.
- Scripts created inside the add-in are saved in the workbook, so the code travels with the file.
Limitations and things to know
Running Python in the browser means a sandboxed environment. You may hit memory or CPU limits for very large datasets. For heavy production workflows, a local Python environment may still be better. But for most Excel tasks, Polars in Excel via xlwings lite is a fast, low-friction option.
Conclusion
Using Polars in Excel lets you run fast, readable data transformations without installing Python. Install xlwings lite, add the polars dependency, and start writing functions or scripts inside the add-in. You can compute aggregates, build summary sheets, and even generate charts with a few lines of code. If you want more detail on the add-in itself, my longer walkthrough of xlwings Lite covers the basics and more examples. Try the steps above, and you’ll have Polars in Excel working in minutes.