
Turn your Excel data into charts with personality.
CutePlots is the Excel add-in for hand-drawn charts. Select your cells, choose a style, and bring a little character to your next slide, report, or post.
The current version is no longer offered.
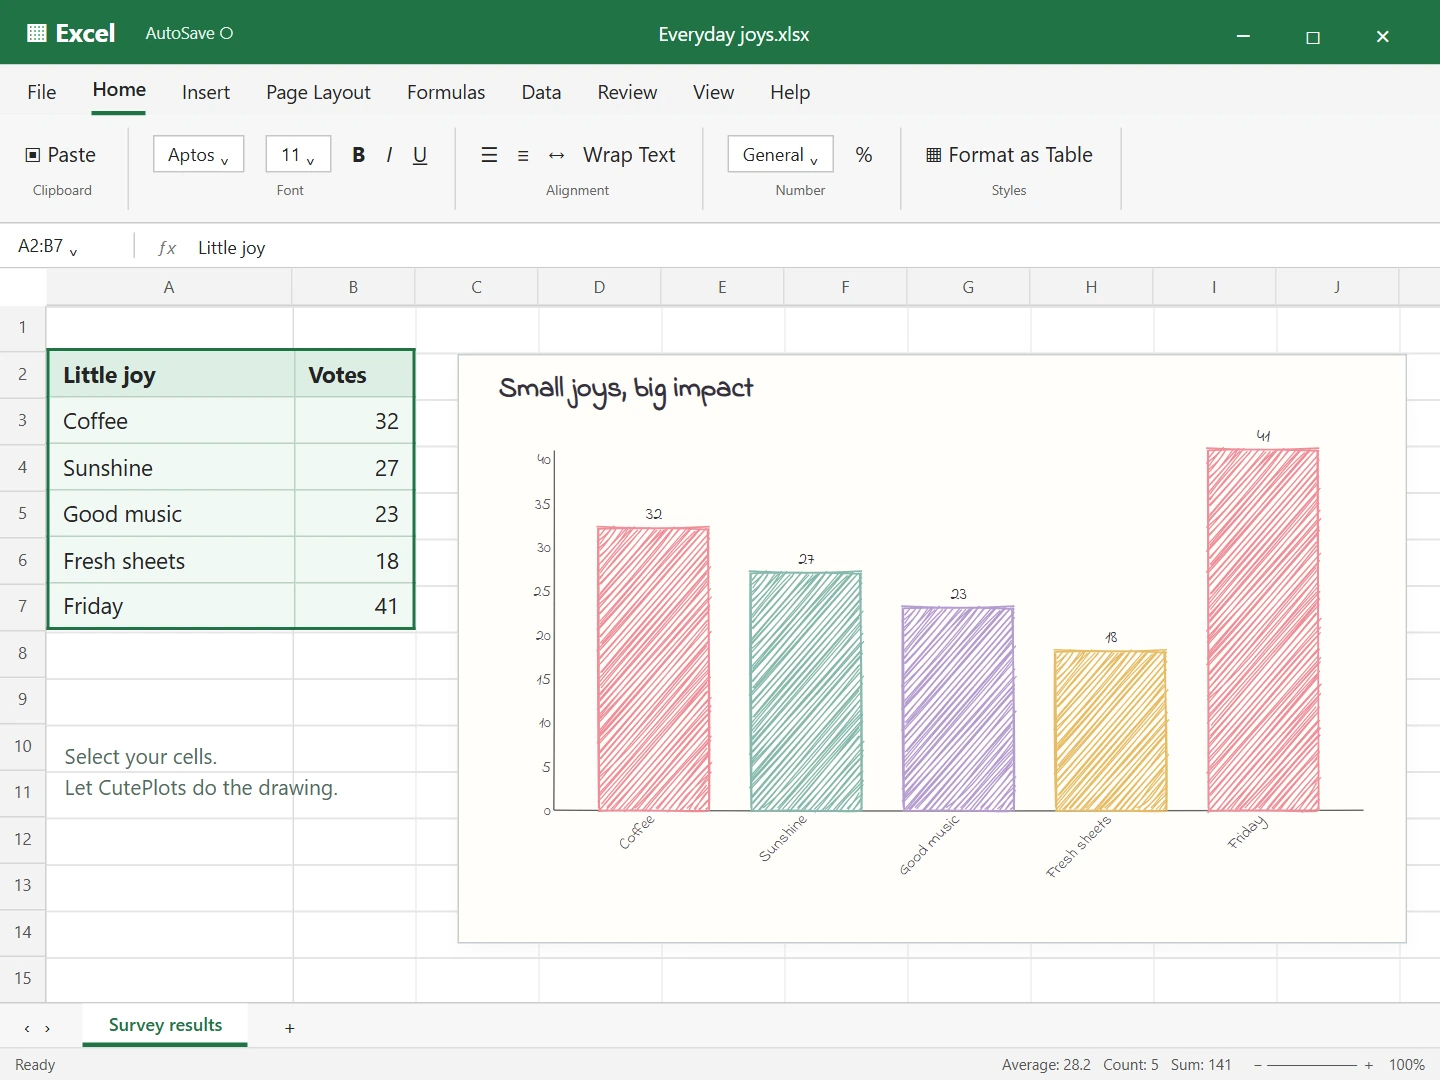
Your cells. Your chart. All inside Excel.
A small table. A much more interesting story.
Pick a chart, change a number, and try a different fill. These are the same charts you can make inside Excel.
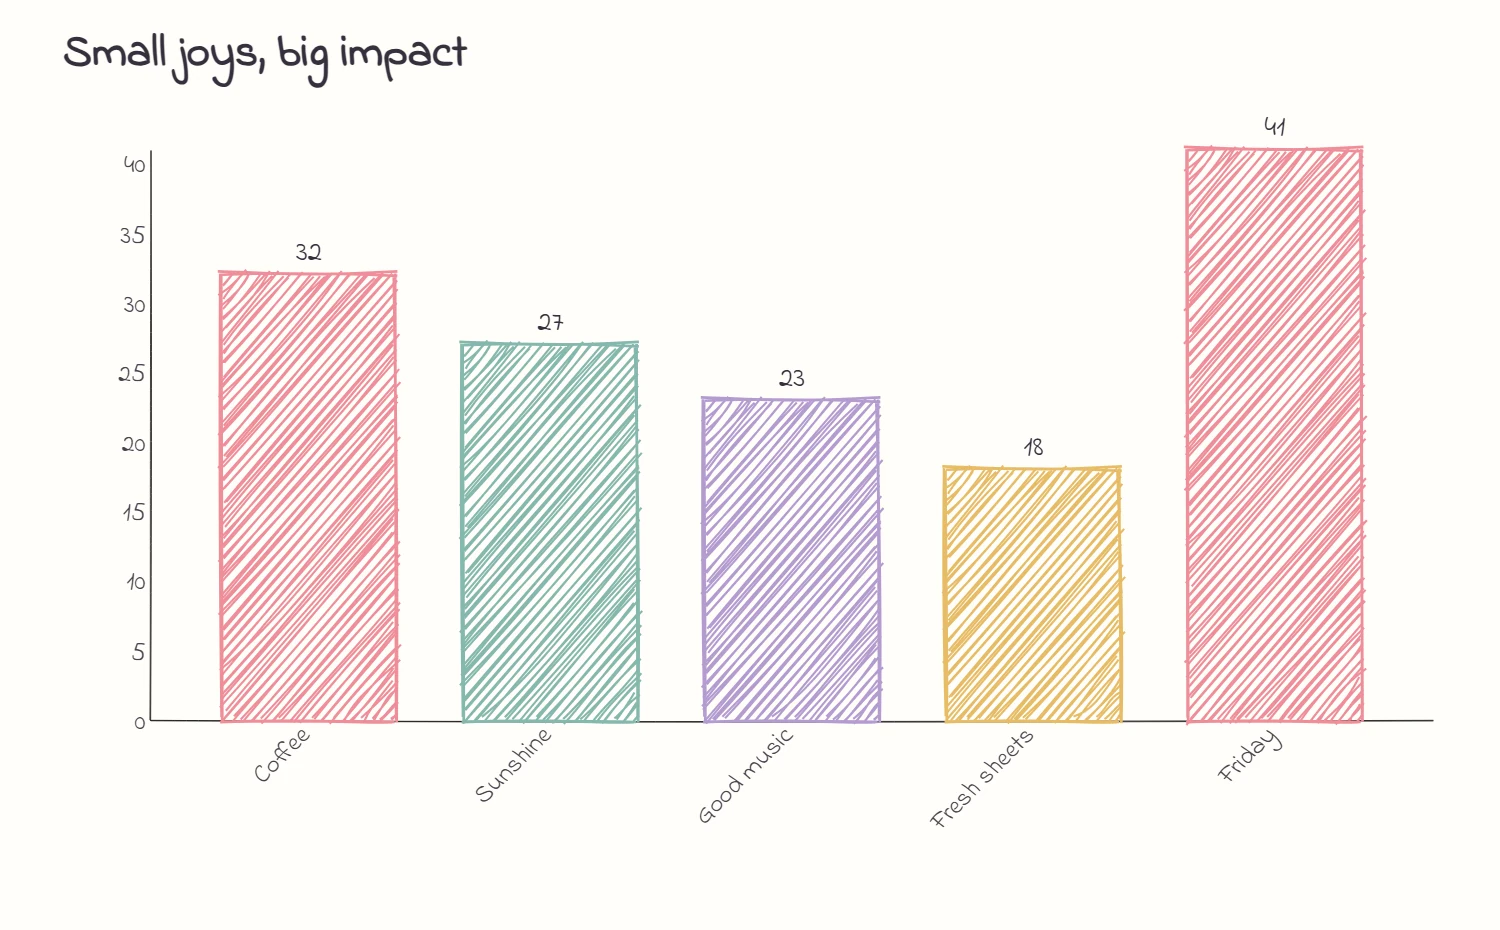
Compare categories at a glance.
A preview of what you can make with CutePlots.
Try the Pro look here. The free Excel add-in includes a watermark; paid licenses remove it. Switching chart types loads fresh sample data.
You bring the numbers.
CutePlots brings the character.
Work in the CutePlots panel beside your spreadsheet. See your chart take shape as you go.
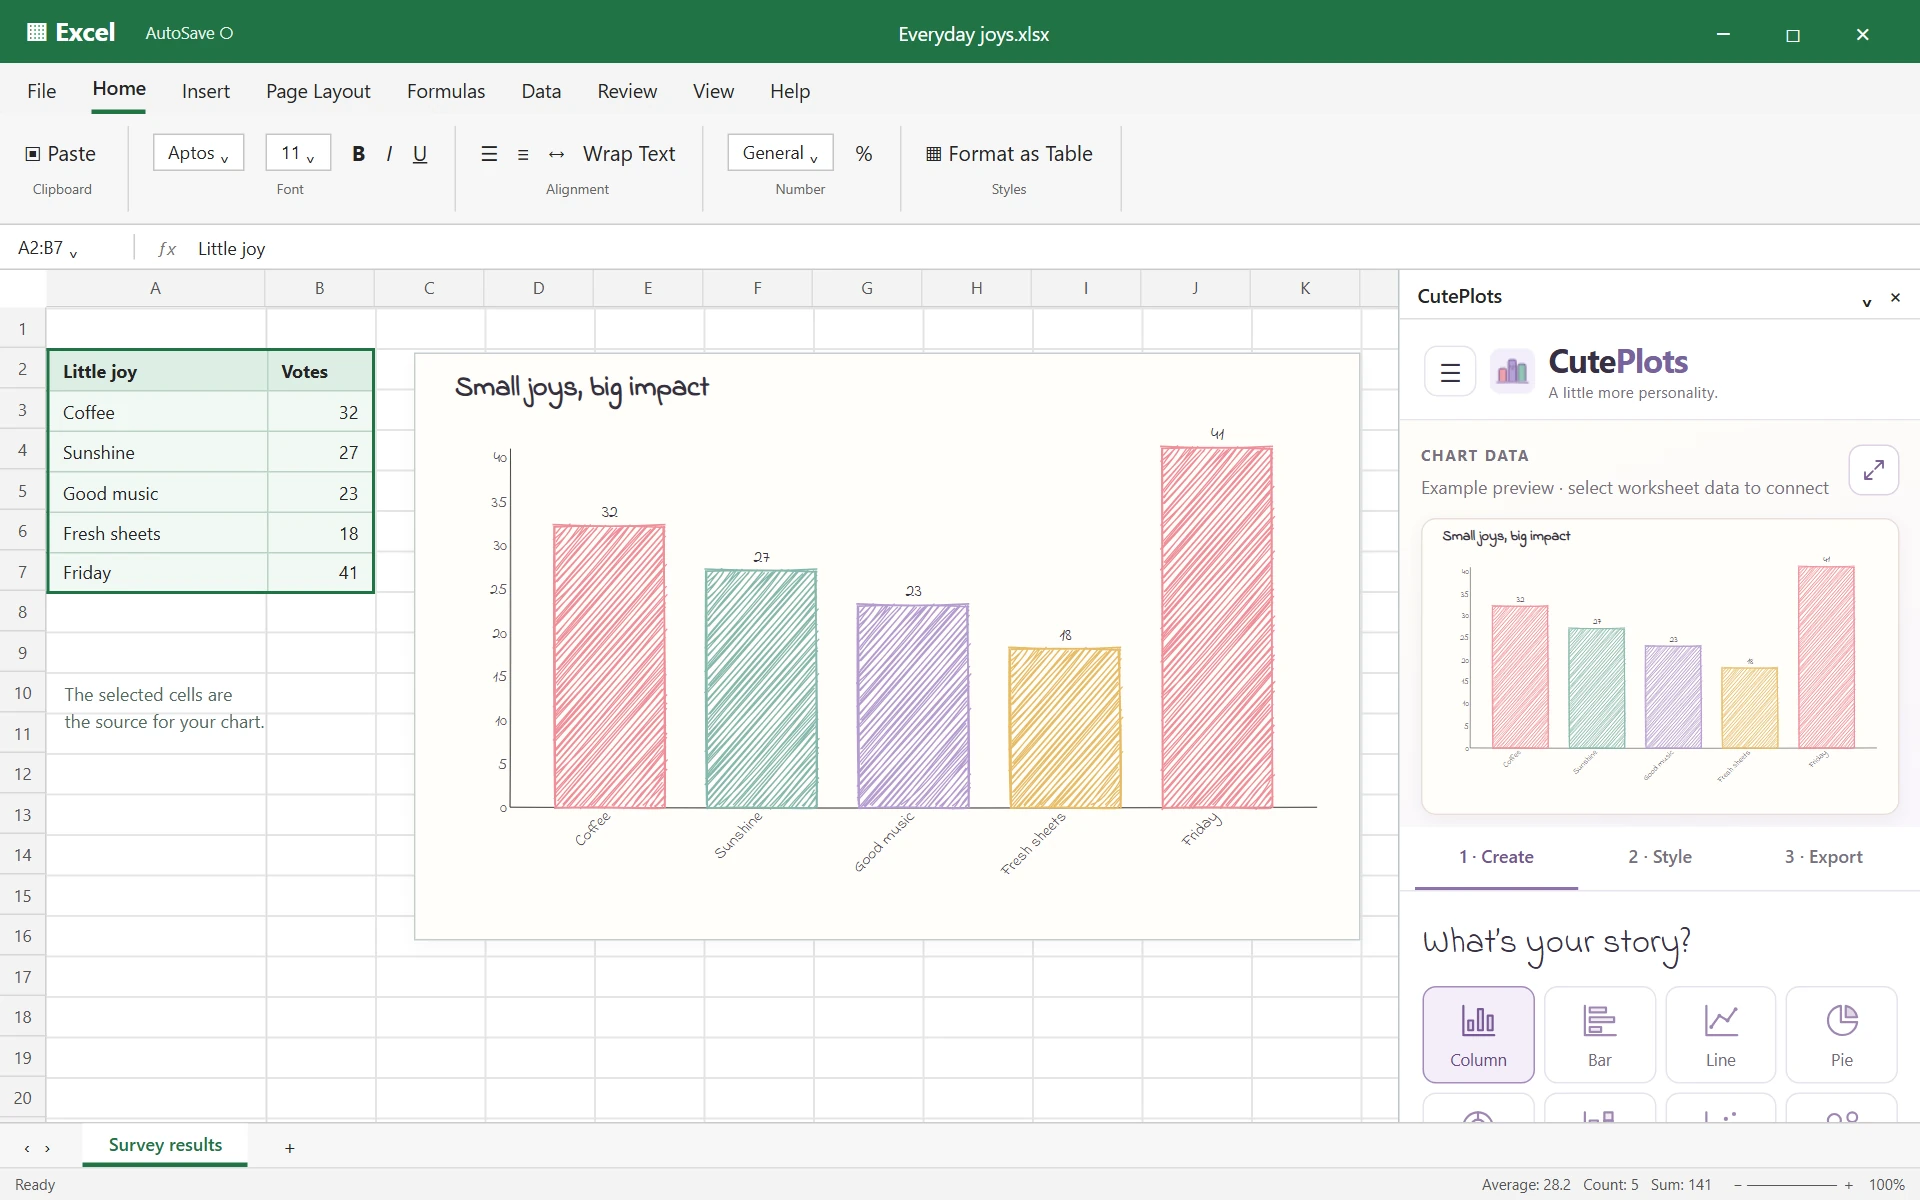
There is a story in that spreadsheet.
A hand-drawn chart gives you another way to tell it.
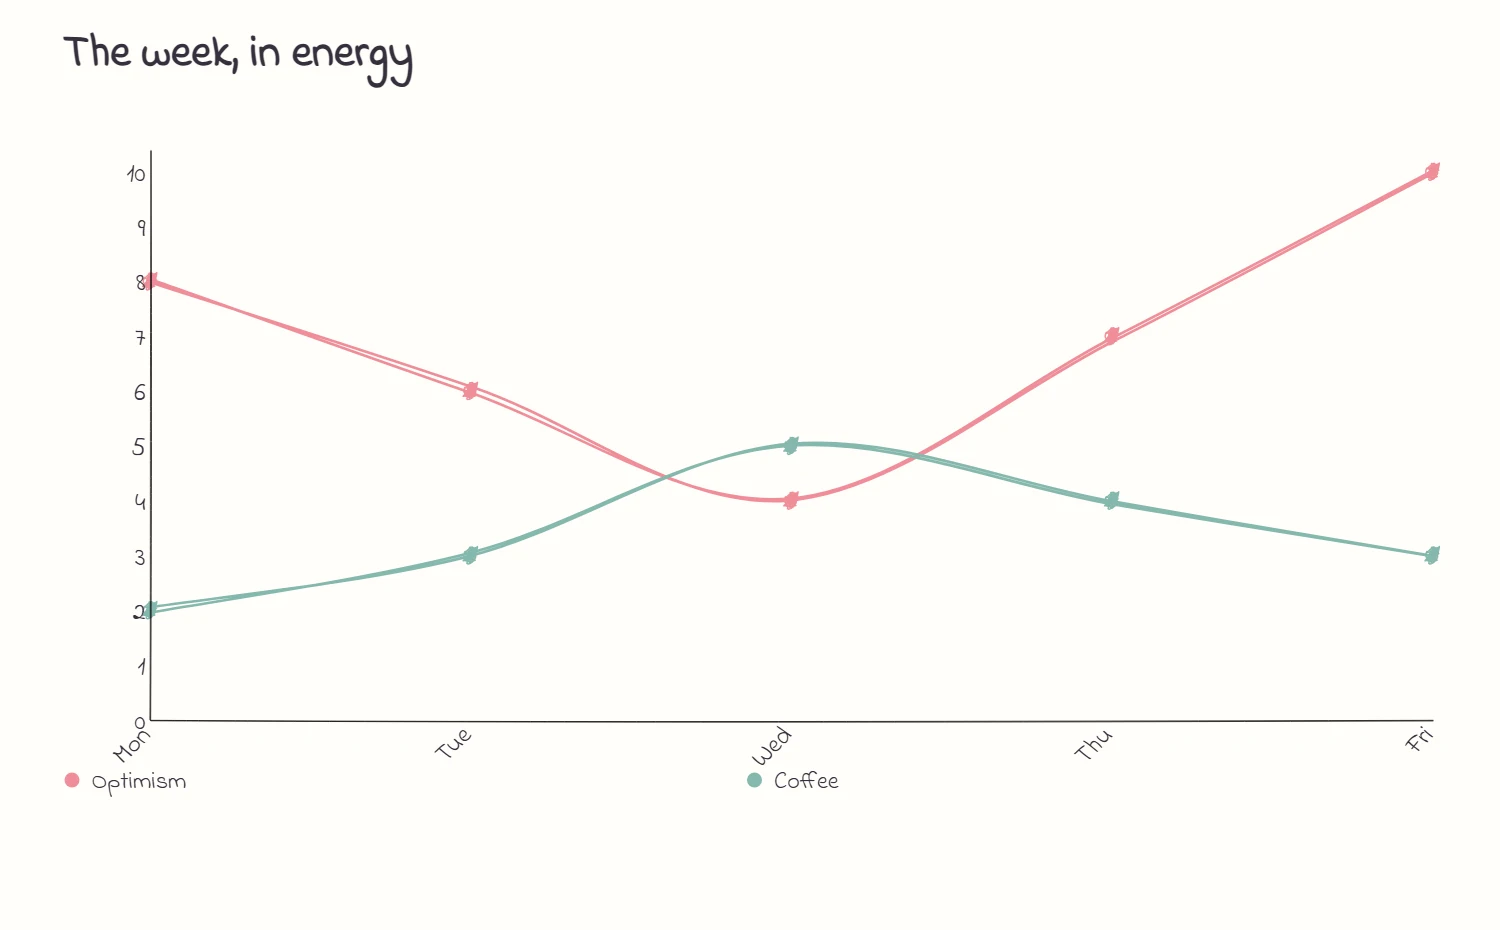
Open your next presentation with a smile.
Turn a familiar trend into a slide with character. Copy the chart as a picture and place it straight into your slides.
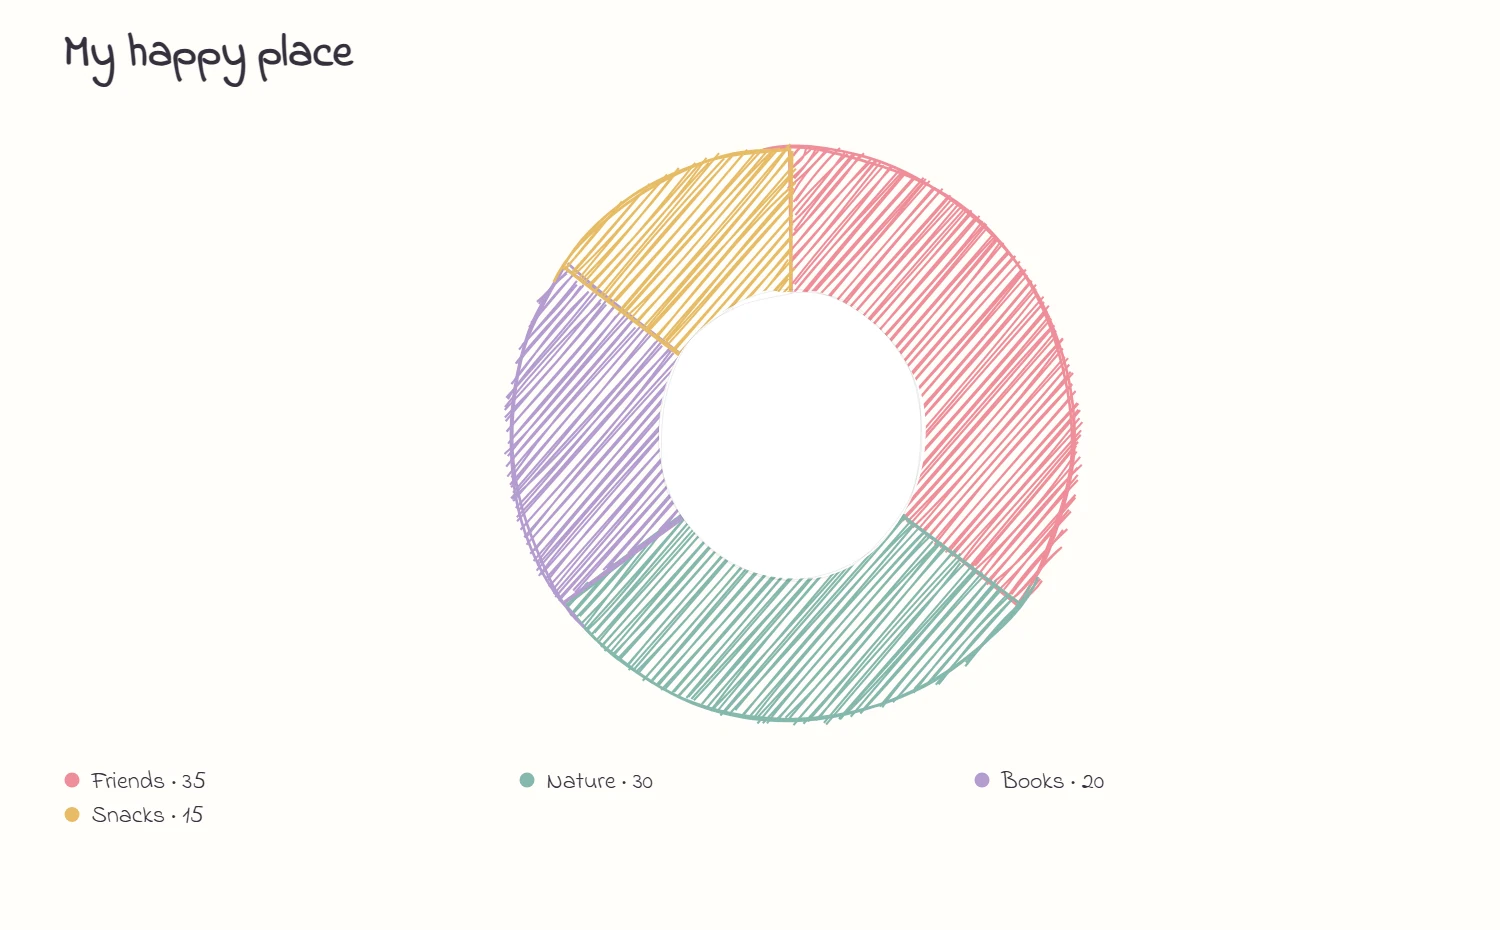
Give your next post a visual hook.
Make a chart that feels at home in your newsletter or social feed. Choose a look, add your title, and export it.
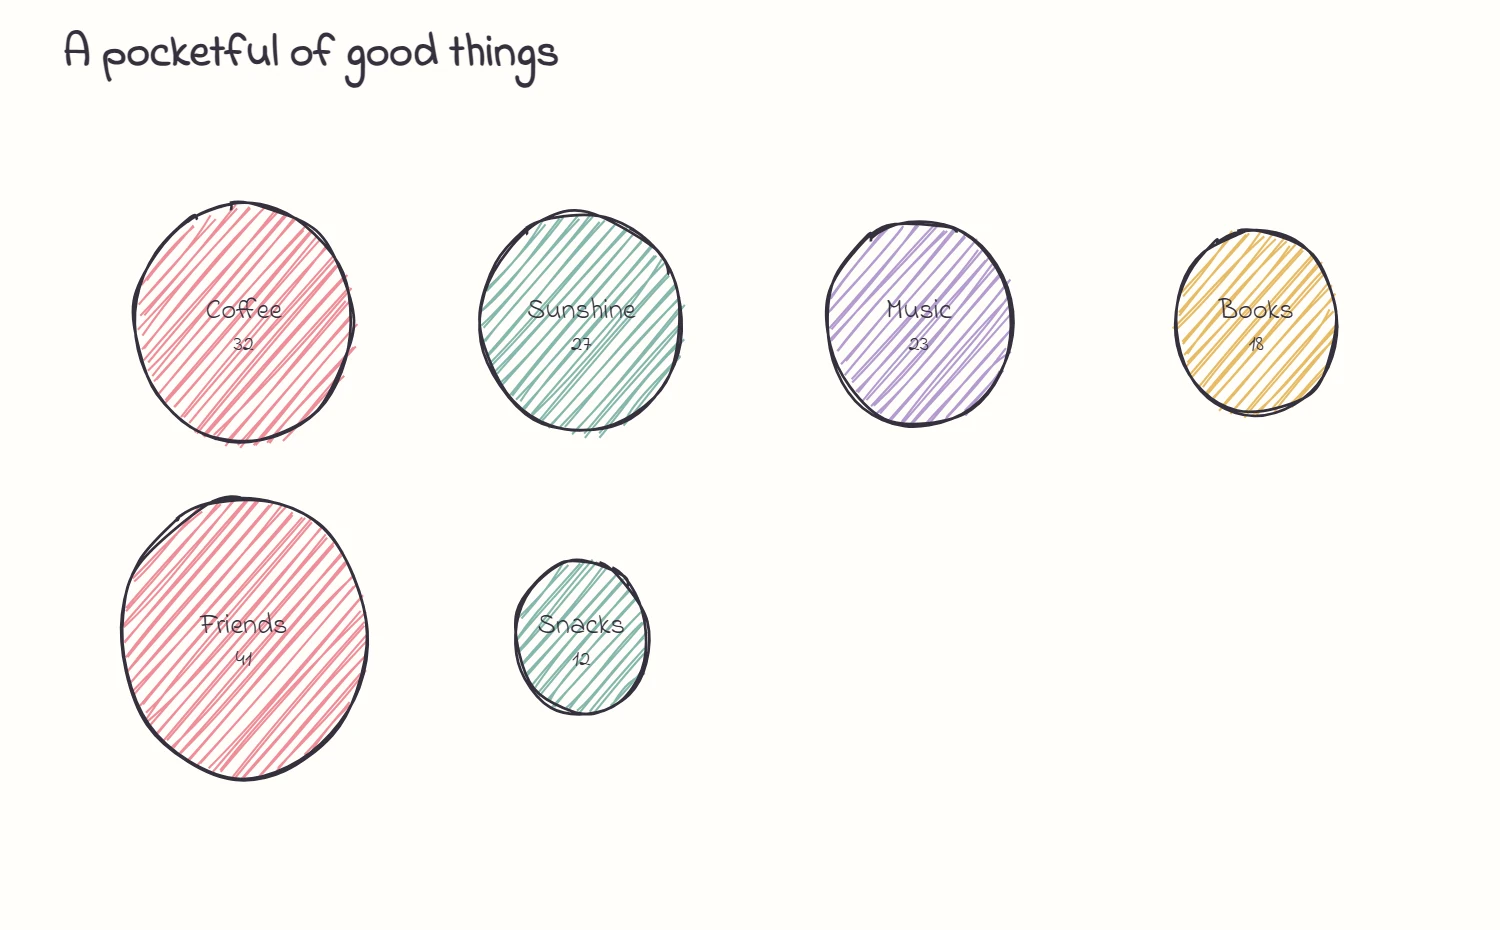
Make a lesson more inviting.
Use a class poll, a simple comparison, or a few everyday numbers. Share an interactive chart students can open in their browser and explore by hovering or tapping.
Pay once, no subscription
Every chart type is free. Both paid plans remove the watermark. Choose a lifetime license for yourself or your team.
- All 9 chart types, free forever
- Every palette and fill style
- Insert, download, and share
- CutePlots watermark included
The current version is no longer offered.
- 1 user, up to 3 devices
- All 9 chart types and styling controls
- No watermark on your charts
- One payment. No subscription.
The current version is no longer offered.
- Up to 15 users
- All 9 chart types and styling controls
- No watermark on your charts
- One payment. No subscription.
The current version is no longer offered.
14-day money-back guarantee.
Try it with your own data. If it is not for you, get your money back.
- Excel on Windows
- Excel on Mac
- Excel on the web
- Microsoft 365 or Office 2021 and later
A few things you might be wondering

Still have a question?
I’m Sven, the developer, and I usually reply within a day.
Make your next Excel chart a little more you.
Start with your cells. Finish with a chart worth sharing.
Working on a new releaseThe current version is no longer offered.
CutePlots is an independent product by Bosau Digital LLC. It is not affiliated with, endorsed by or sponsored by Microsoft. Microsoft and Excel are trademarks of the Microsoft group of companies.