
Turn your Excel data into an interactive Gantt chart in one click
Pick your table. The chart is drawn right next to it.
- Hover a bar for dates, owner and progress
- Fold phases open or closed
- Export to PowerPoint, PDF or HTML
Every feature free for 14 days. No account, no card. Excel on Windows, Mac and the web.
Reviewed by Microsoft Listed on Microsoft MarketplaceAn Excel table with ten tasks, start and end dates, progress and predecessors becomes a Gantt chart on the sheet: the phases Plan and Build, progress bars, dependency arrows, the milestones Sign-off on October 23 and Launch on December 11, and a today line on November 17. One click puts the chart on a PowerPoint slide.
See it in under two minutes
Change a date. The chart follows.
A real plan in Excel with its SimpleGantt chart. One end date moves out a week, and the bar grows with it.
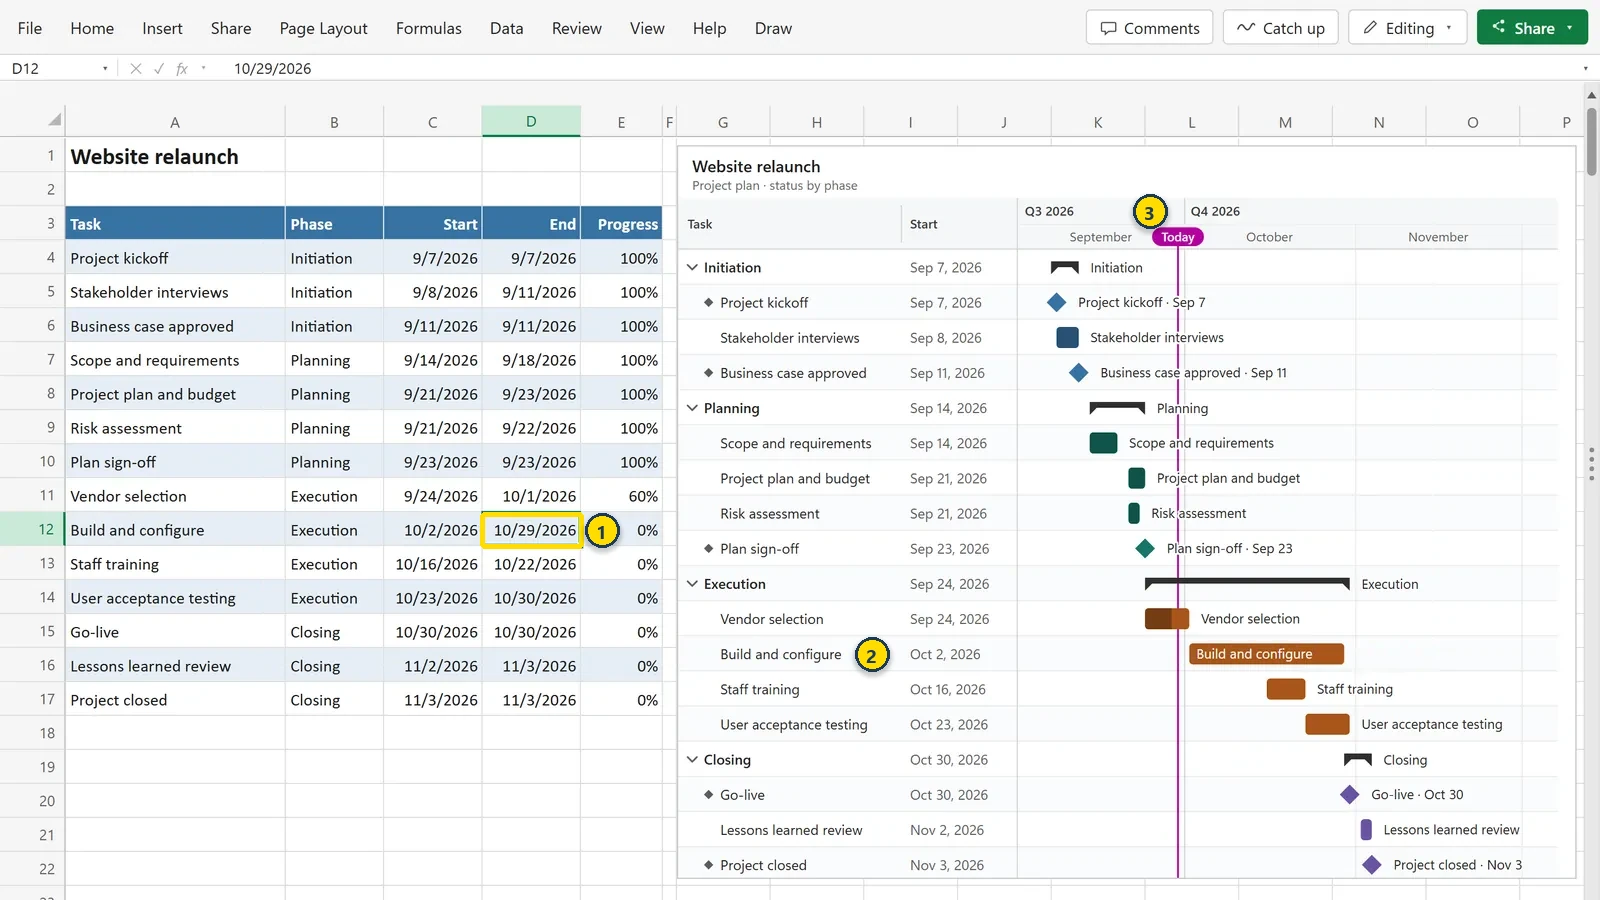
- You edit the tableTasks, dates and progress stay in your own Excel table.
- The bar followsBuild and configure now ends Oct 29. Nothing to refresh.
- Today at a glanceA today line, phases that fold and milestones with their dates.
How to use it
From your task list to a slide in three steps.
Pick your plan
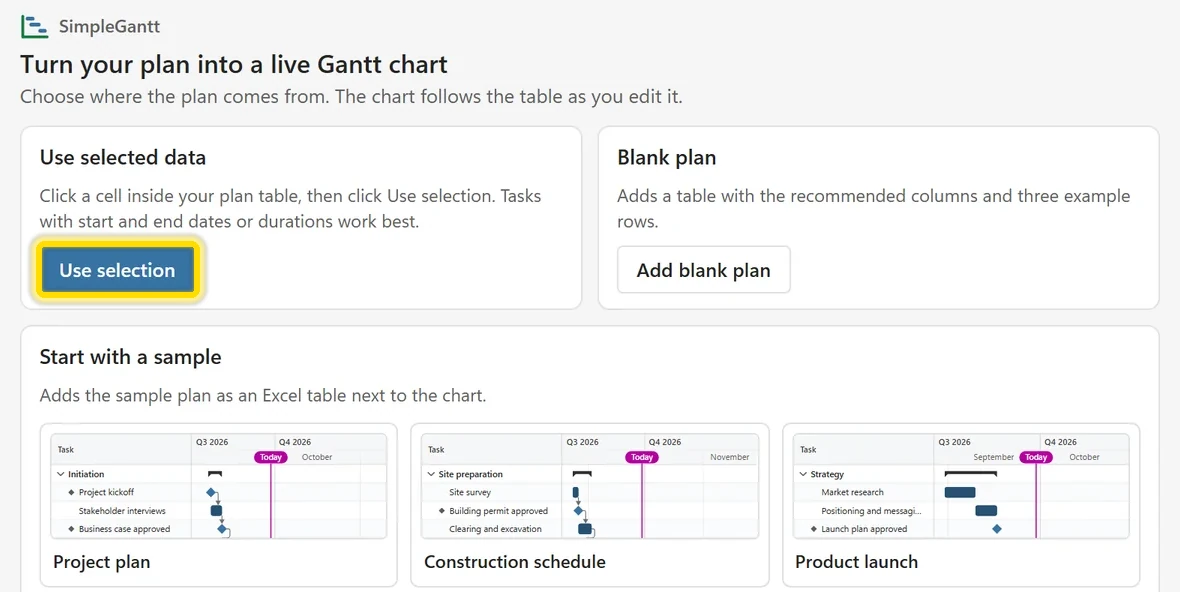
Click any cell in your task table, then Use selection. SimpleGantt finds the tasks and dates. No table yet? Start with a sample.
Choose the look
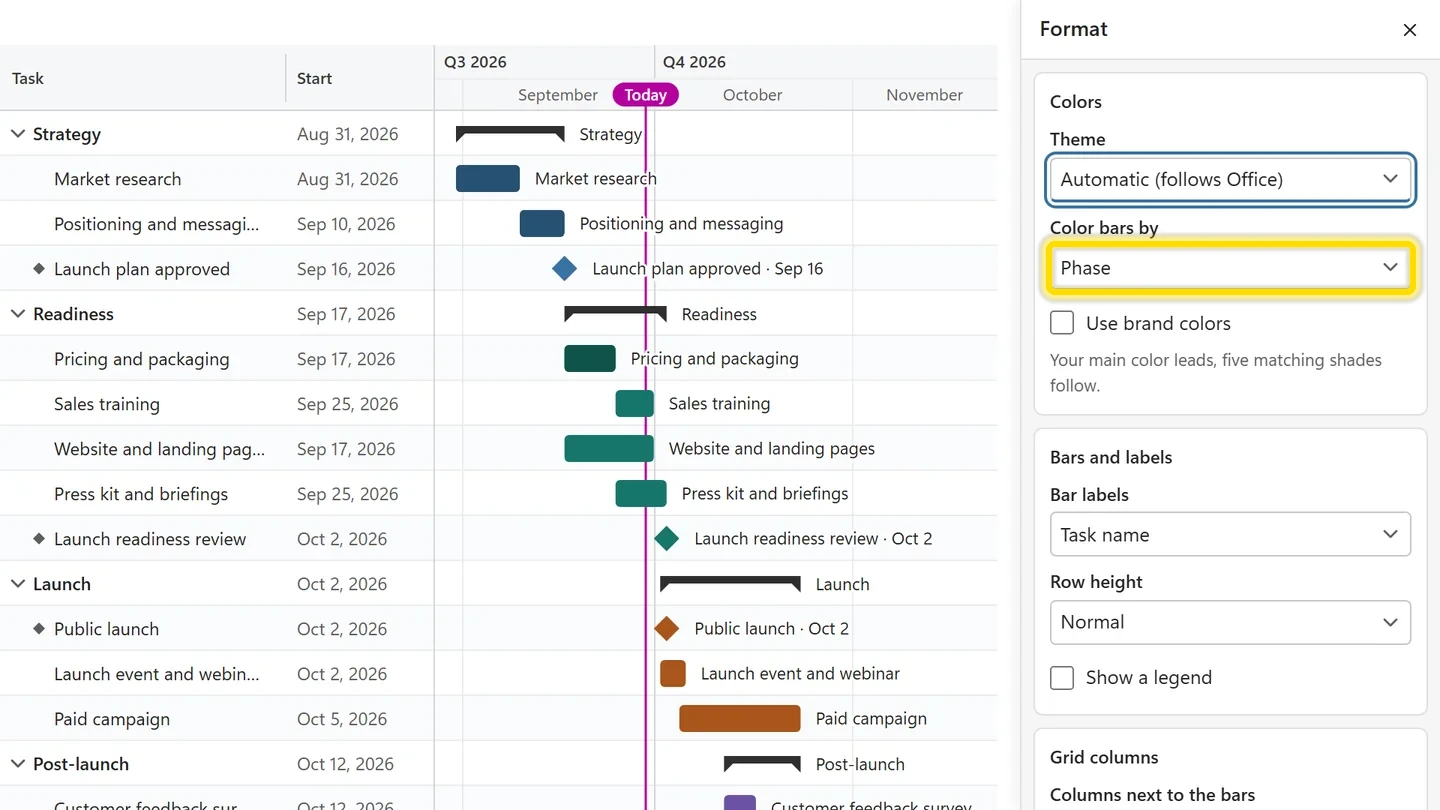
Open Format on the chart. Color the bars by phase, owner or status, pick the labels and the row height.
Take it to the meeting
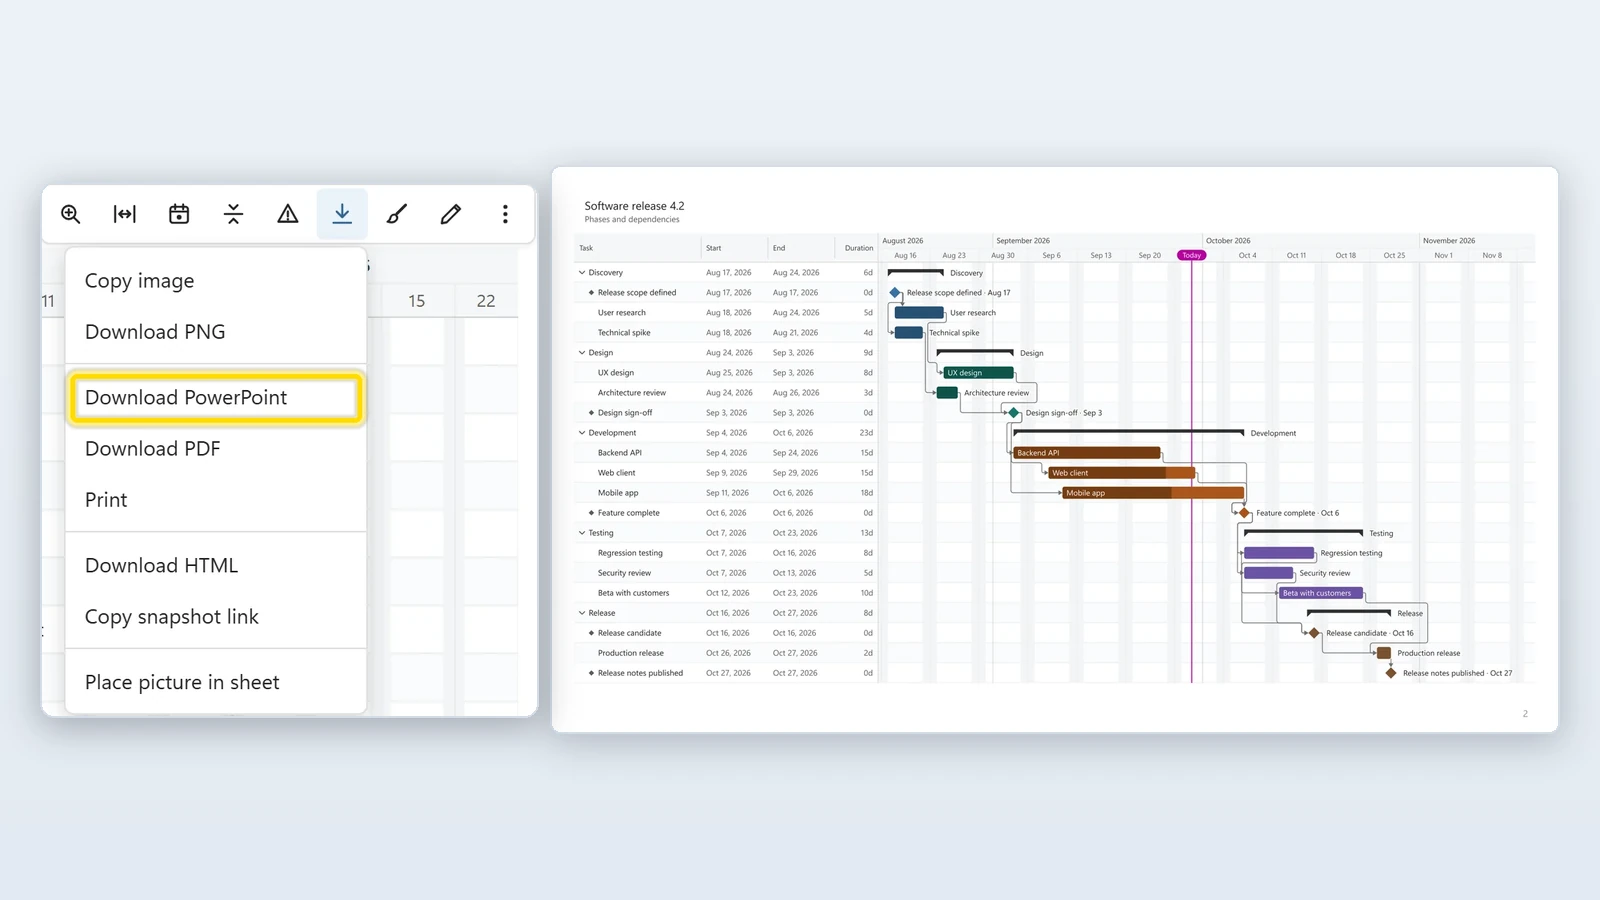
Open the Export menu and choose Download PowerPoint. Long plans are split across slides, the header on each one.
Everything a project plan needs
Drawn from the columns you already have.
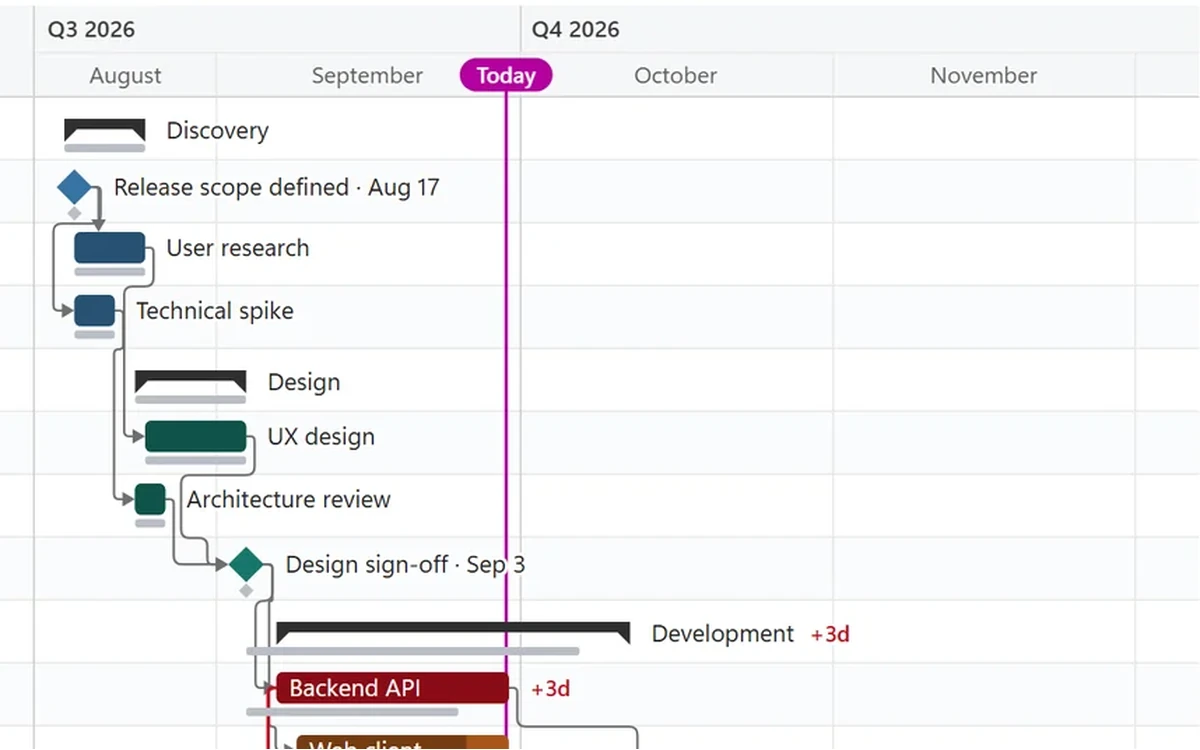
Critical path and slip
Arrows from your Predecessors column. The critical path in red, and the days each task slipped since the baseline.
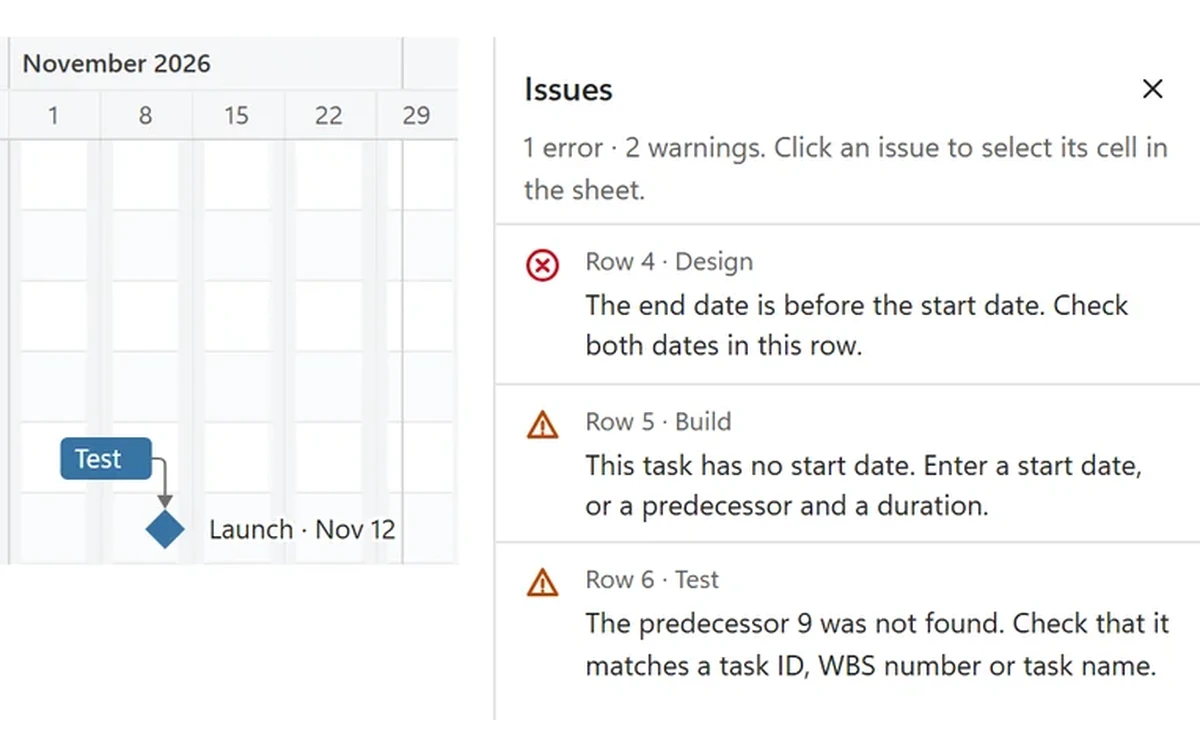
An Issues list
A missing date or an unknown predecessor? Click the issue and Excel selects the cell.
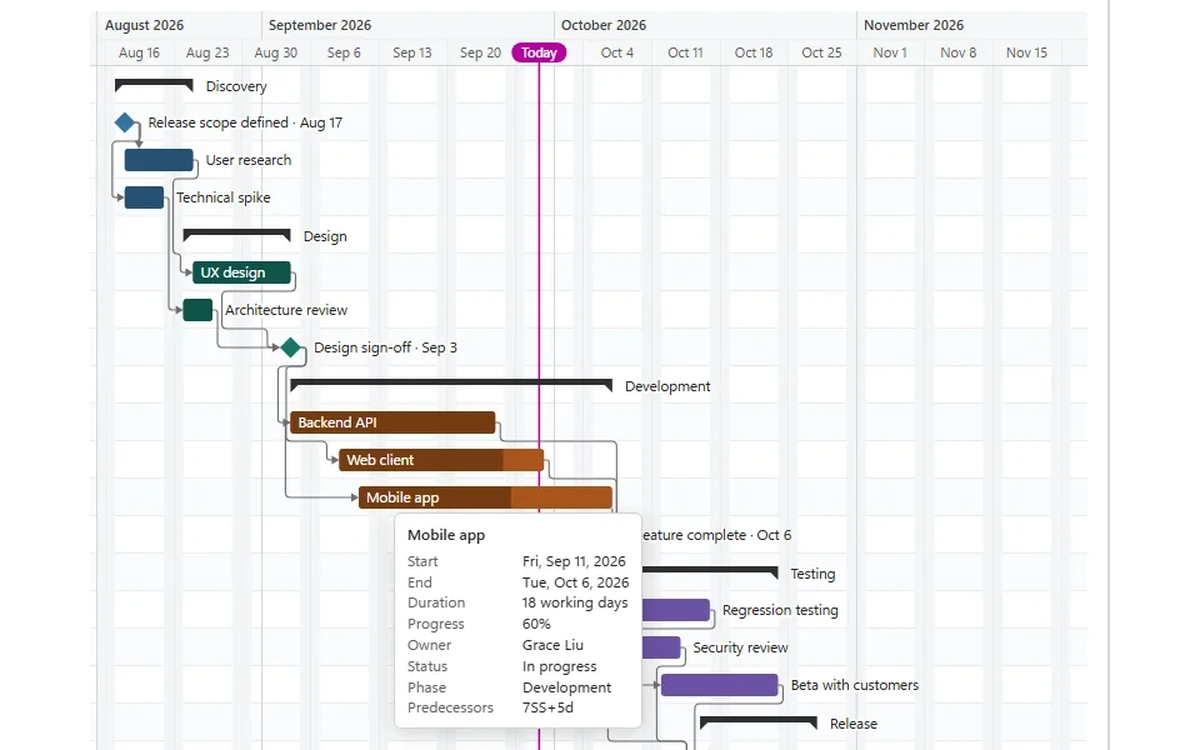
Interactive HTML file
One file that opens in any browser. Readers zoom, fold phases and point at a bar for details.
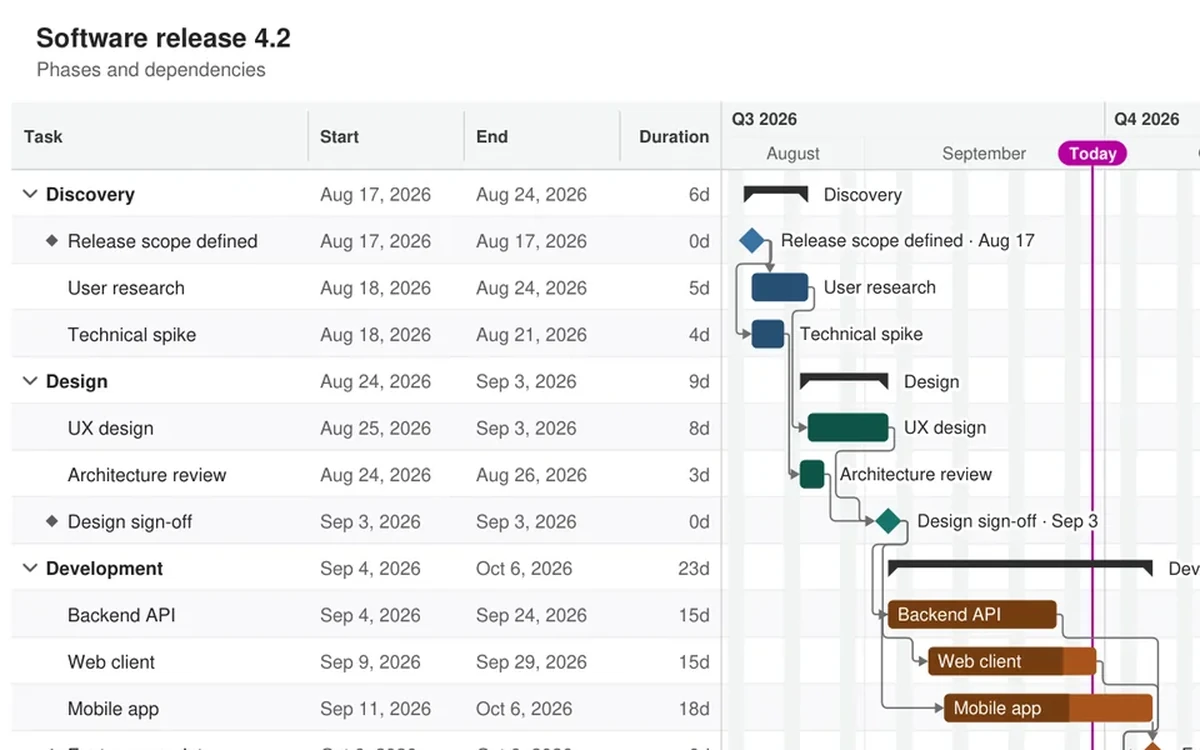
PDF and print
Sharp pages in A4, A3, Letter or Tabloid, with the header on every page.
 Phases that foldGroup by WBS number, outline level or a Phase column.
 Milestones and progressDiamonds with their date, progress inside each bar.
 Working days and holidaysWeekends skipped, holidays from your own Holidays table.
 Hours to yearsAn event day by the hour or a build over three years.
 Your colors and logoOn every chart and every slide you export.
 Follows your filtersFilter the table and the chart shows the same rows.
Installed in about a minute
Straight from Microsoft's add-in store, inside Excel. No installer file, no macros, and every feature free for 14 days.
- 1In Excel, go to Home → Add-ins → More Add-ins.
- 2On the Store tab, search for SimpleGantt by Bosau Digital.
- 3Click Add. A chart frame appears on the sheet: click Use selection or pick a sample.
Depending on your Excel version, look under Insert → Get Add-ins instead.
- Windows, Mac and the web
- No macros
- Colleagues need no license
- Your plan stays in Excel
Pay once. No subscription.
Every feature is free for 14 days, with no account and no card. Then keep the free version, or buy a license once.
- Every feature for the first 14 days
- Then up to 10 tasks, 1 chart per workbook
- PNG export with a "Made with SimpleGantt" badge
- 1 user on up to 3 devices
- Unlimited tasks and charts
- Dependencies, critical path, baselines and holidays
- PowerPoint, PDF, HTML and snapshot links
- Your colors and logo, no badge
- Free updates
- Your team on up to 15 devices
- Unlimited tasks and charts
- Dependencies, critical path, baselines and holidays
- PowerPoint, PDF, HTML and snapshot links
- Your colors and logo, no badge
- Free updates
Sven, SimpleGantt developer
- Excel on Windows
- Excel on Mac
- Excel on the web
- Microsoft 365 or Excel 2021 and later
Frequently asked questions

Still have a question?
I’m Sven, the developer, and I usually reply within a day.
Your next status meeting, without the rebuild
Add SimpleGantt to Excel and turn your plan into an interactive Gantt chart. Every feature is free for 14 days.
Add to Excel, freeSimpleGantt is an independent product by Bosau Digital LLC. It is not affiliated with, endorsed by or sponsored by Microsoft. Microsoft, Excel and PowerPoint are trademarks of the Microsoft group of companies.