
Connect a worksheet range #
- Select your data in Excel, including column headings. You can also click one cell inside a complete data block.
- Choose a chart type under Create.
- Press Use selection. The worksheet and range appear above the preview.
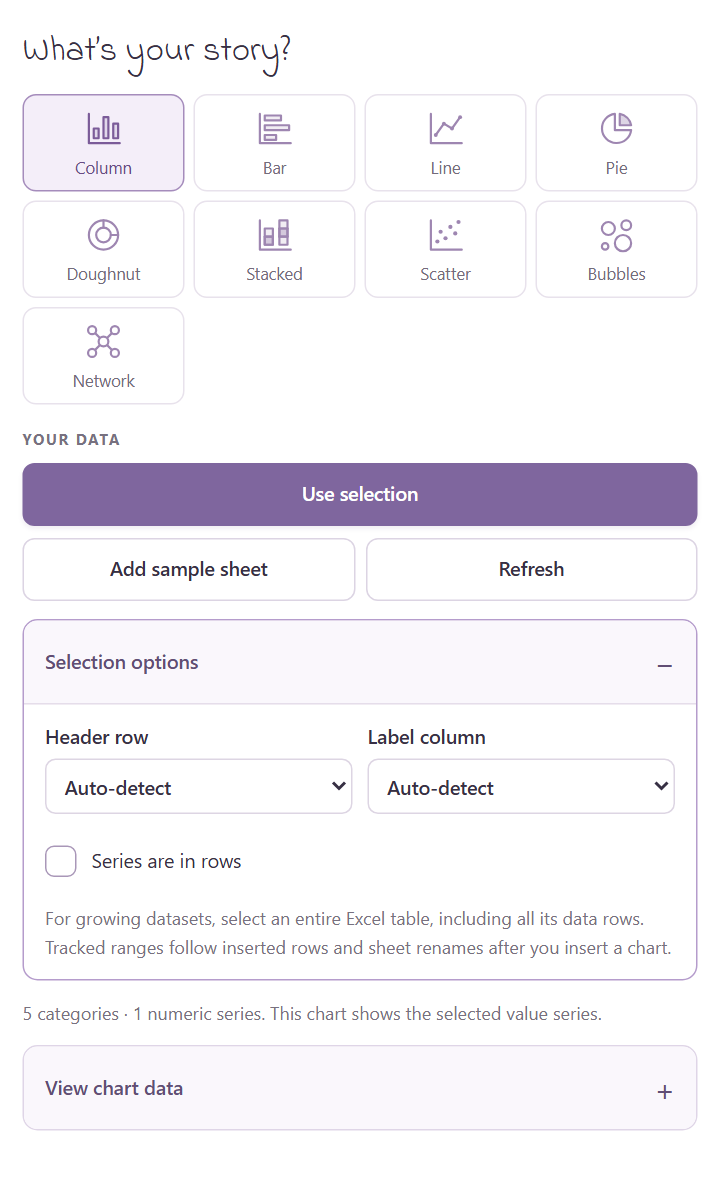
If headings or labels look wrong, open Selection options. Turn on Series are in rows when your data runs across the sheet.
Keep growing data connected #
Select the whole Excel table when you want new table rows included. The preview updates while CutePlots is open; press Refresh if it falls behind.
A picture already inserted into Excel needs a separate update. See Update dashboard charts.
Not sure how to arrange the cells for a chart? Choose that type and press Add sample sheet for a working example. CutePlots explains any data that needs fixing beside the preview.