Create & Deploy Your First Python Data Web App in Just 15 Minutes (Step-by-Step)
Introduction
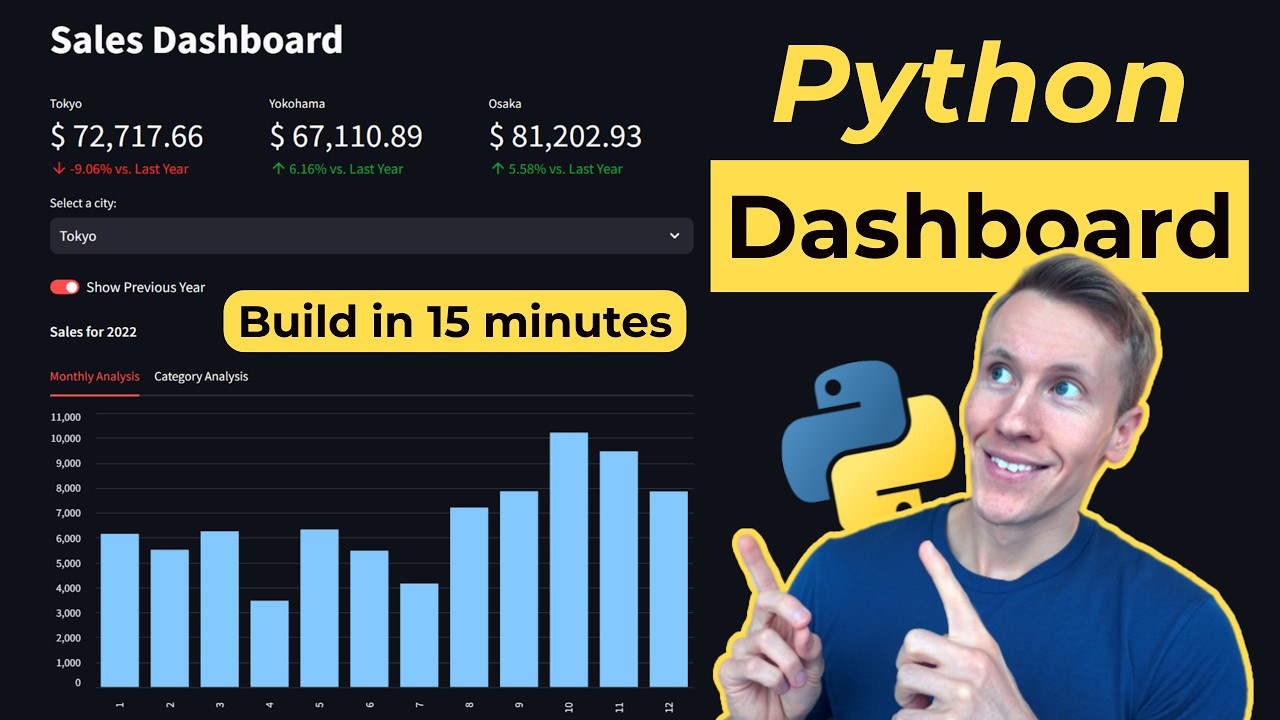
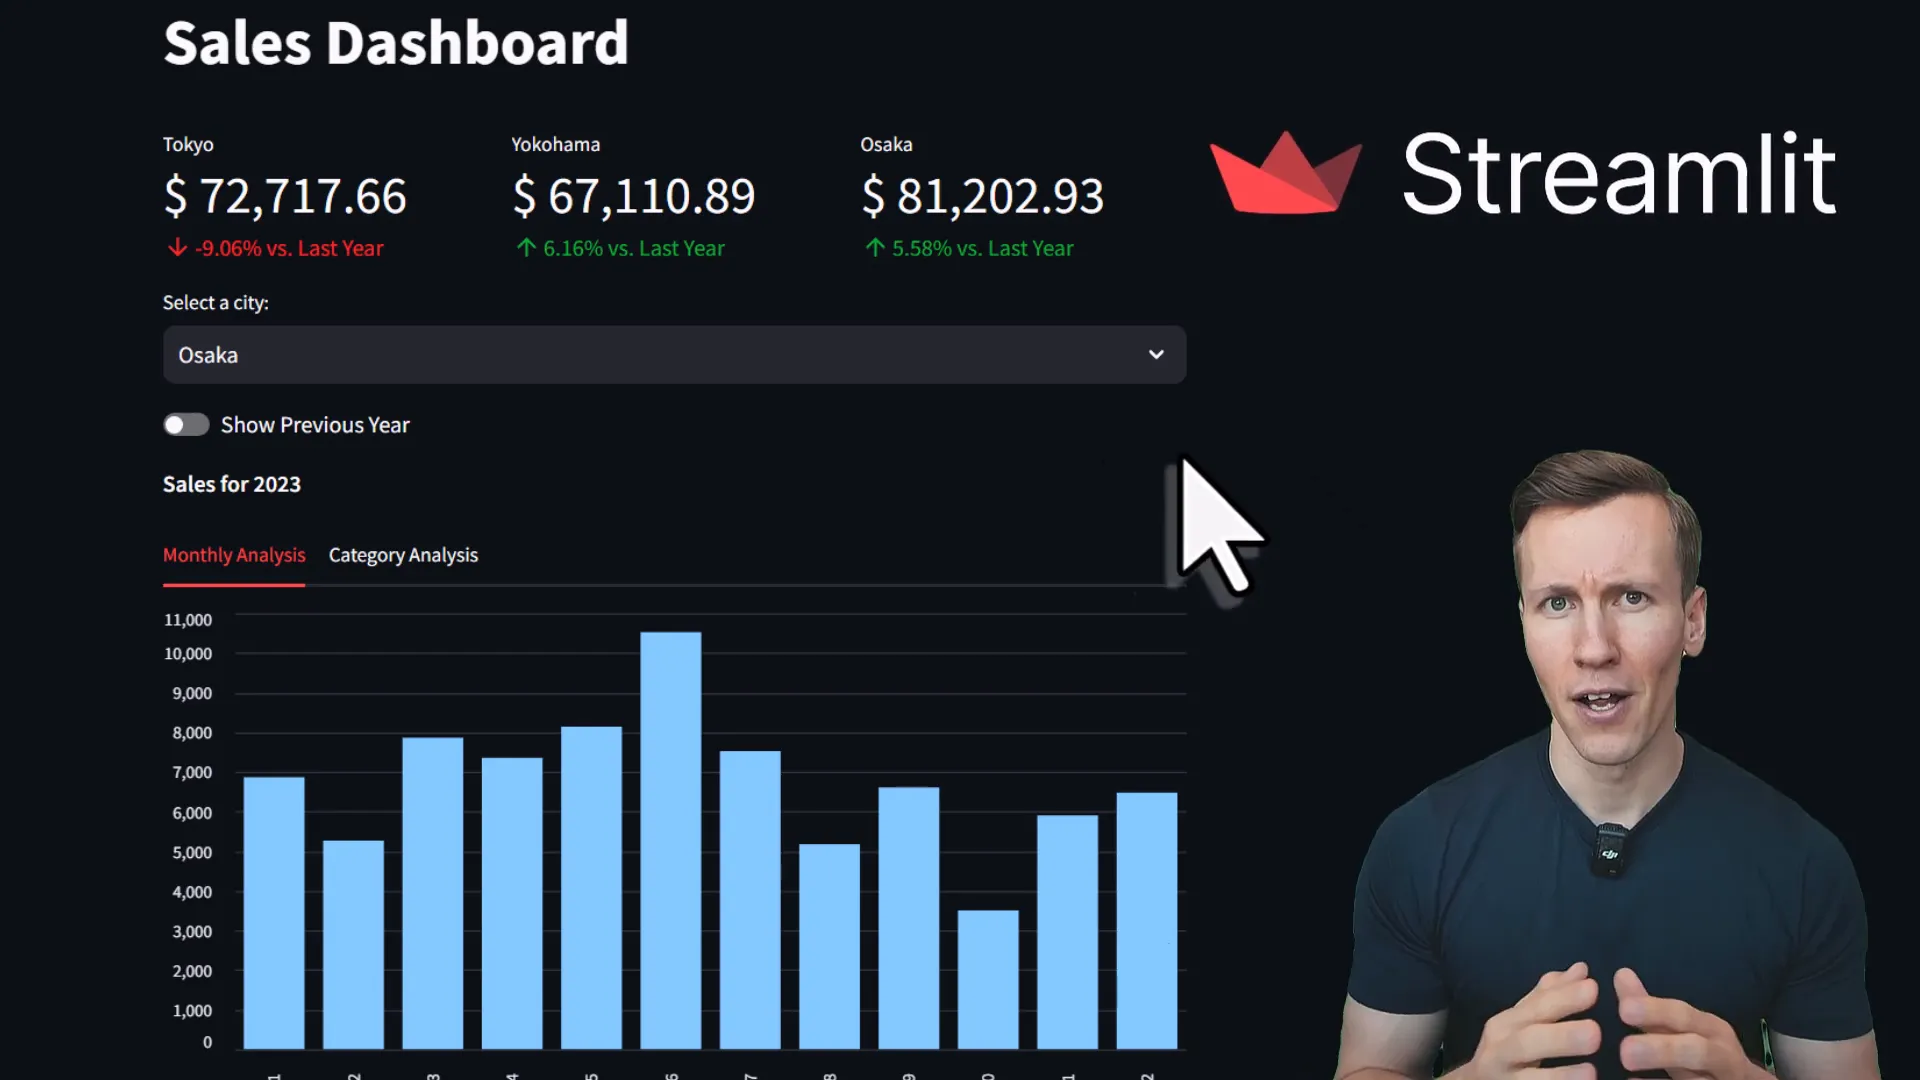
In this post, I will guide you through the steps to build a Python dashboard and deploy it online for free. This dashboard will showcase total sales and how they compare to the previous year. We will also include a filter to view sales by city, along with monthly and category breakdowns. All of this will be done using Streamlit, a Python library that allows you to create web applications without needing to learn HTML, CSS, or JavaScript. Let’s get started!
Installing and importing dependencies
First, I need to install Streamlit. I can do this by running the command pip install Streamlit in my command prompt or terminal. Since I will also be working with data, I will need pandas, which I can install with pip install pandas. After installation, I will create a new Python file named Streamlit_app.py and import the necessary libraries:
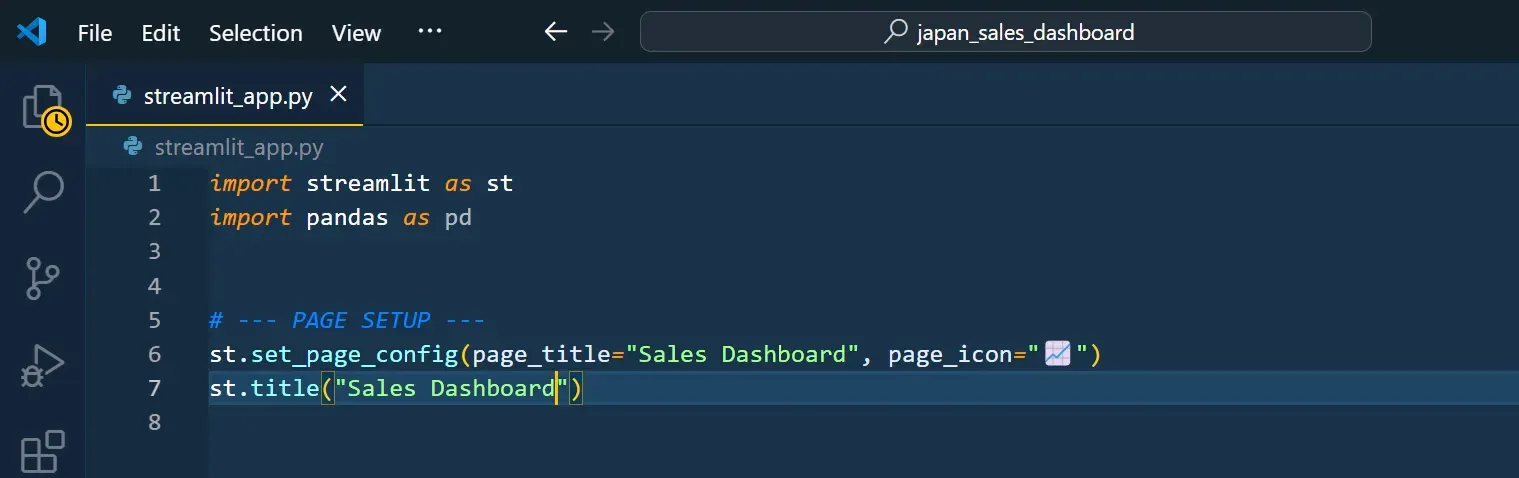
import Streamlit as st
import pandas as pd
Creating a simple web app
Next, I’ll create a simple app to ensure everything is set up correctly. I will give the app a title and icon. For the icon, I can use emojis, which I can access by pressing the Windows key and period on Windows. I will choose the chart emoji for this example. The page title will simply be “Sales Dashboard.” After adding these elements, I will test the app by running it with the command Streamlit run Streamlit_app.py. This will open my default browser and display the app.
Loading and displaying the dataset
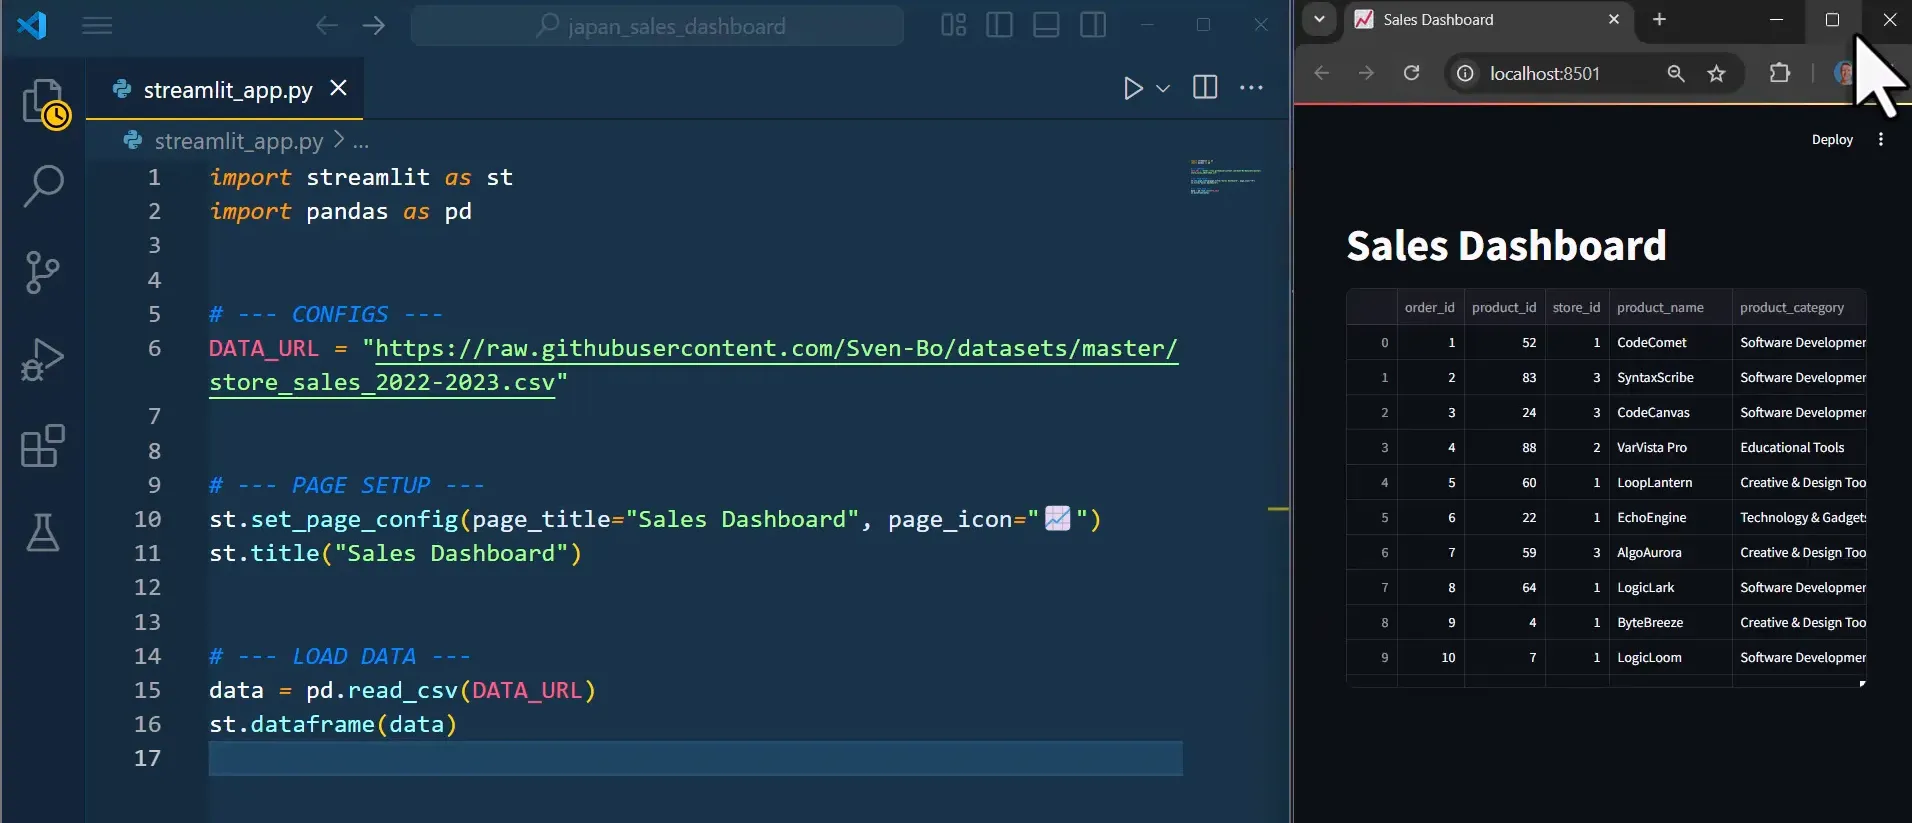
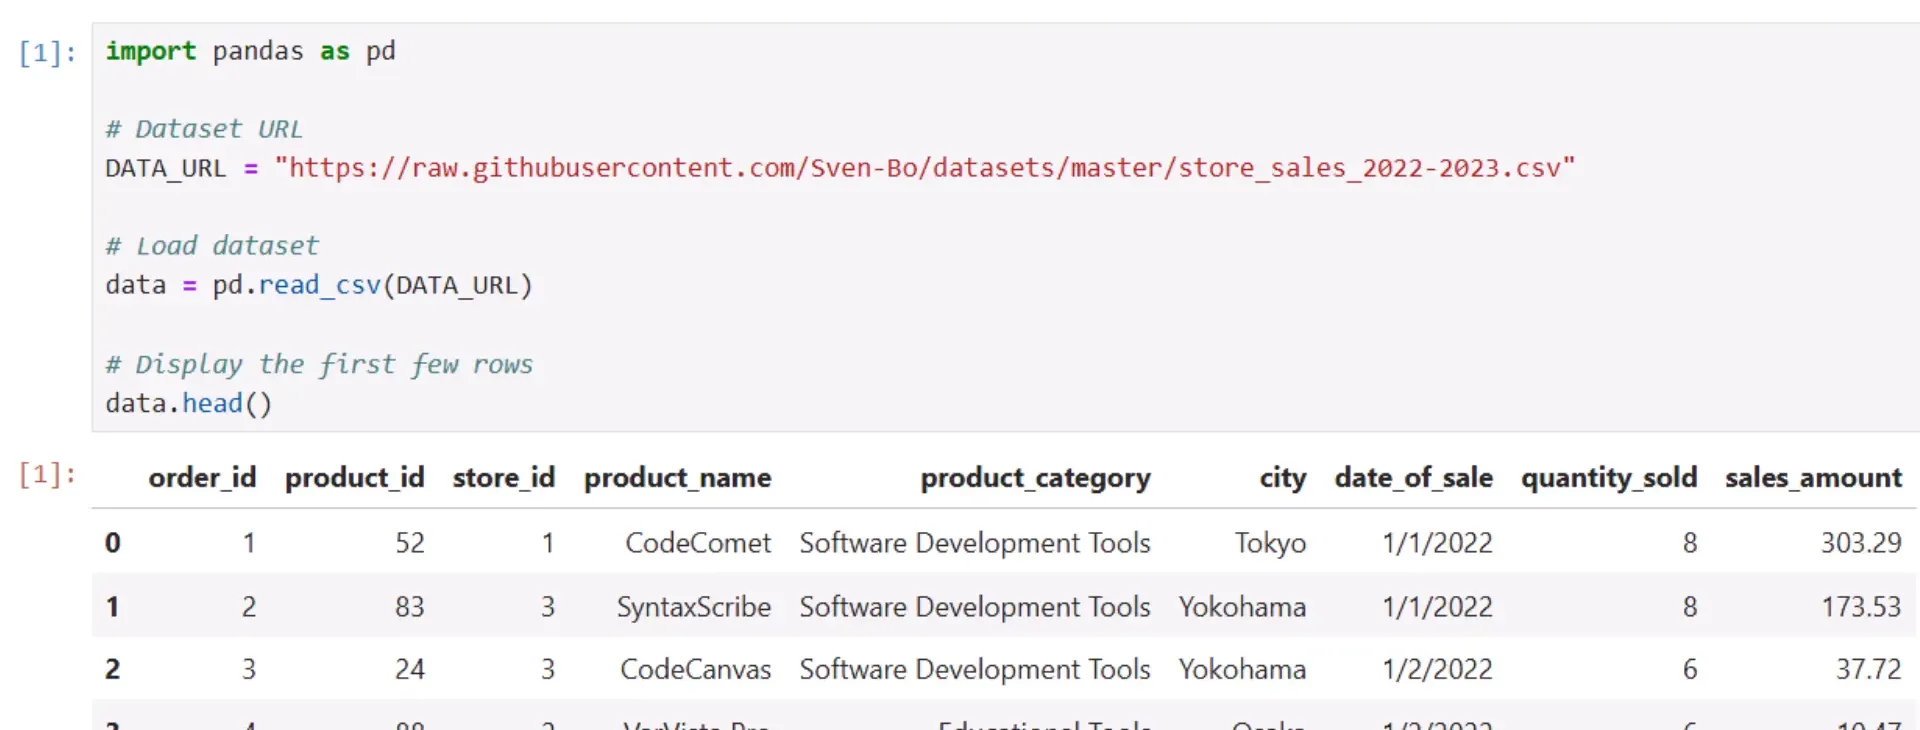
Now, I will load the dataset that I will analyze. At the top of the script, I will create a configuration section where I will insert the link to the dataset, which is a CSV file uploaded to GitHub. I will use pandas to load the dataset and display it in the app using st.dataframe. When I refresh the app, I will see the dataset displayed in the browser.
Cleaning and formatting the data
Before diving deeper, I prefer to clean and format the data in a Jupyter notebook. This helps me understand the dataset better. Once I clean the data, I will copy the relevant code into my Streamlit application. I will display the first three rows of the dataset to give an overview of the data.
Analyzing sales by city
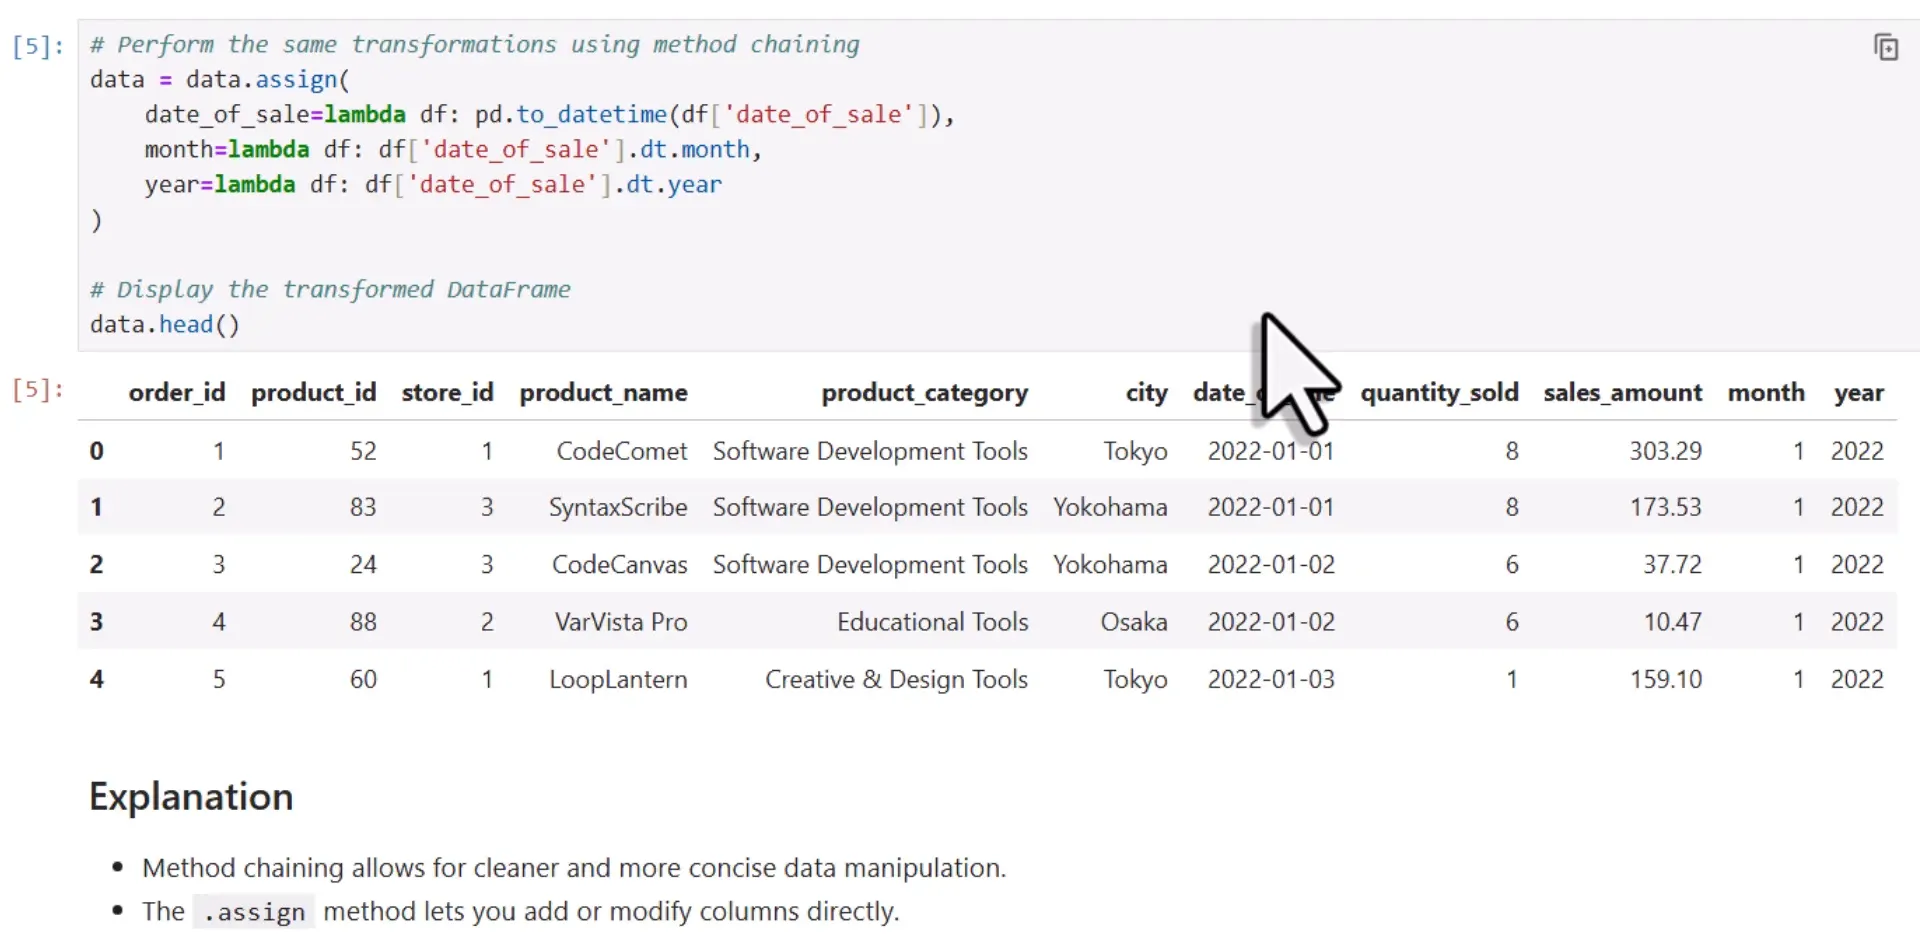
In the final application, I want to visualize sales by city, product category, and month. To do this, I will create separate columns for the month and year from the sales date. I will first check the current data types using the info method from pandas. This will help identify any issues, like missing values or incorrect data types.
Next, I will convert the DateOfSales column to a DateTime object using the to_datetime method. Once converted, I can easily extract the month and year. I will create two new columns for the month and year, and I can use the assign method from pandas to do this in one line.
Adding selection fields
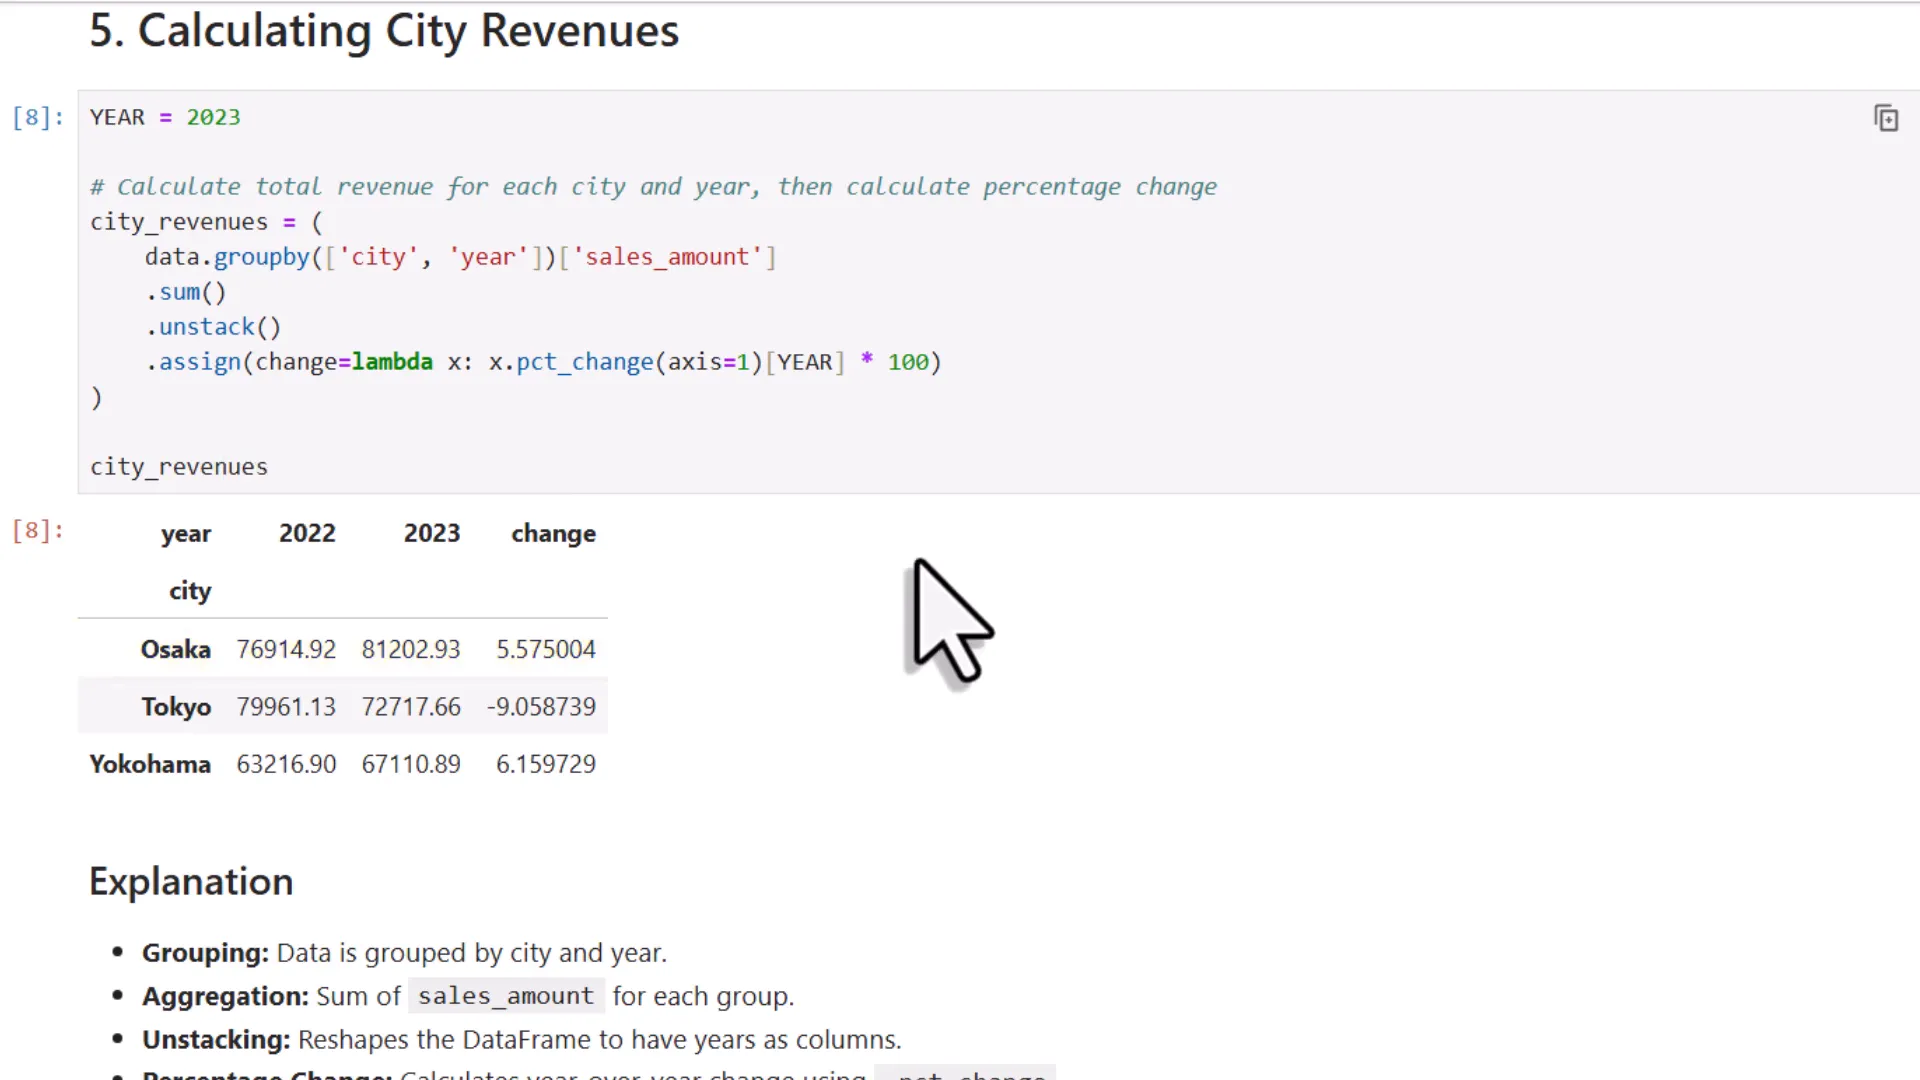
Now that the data is cleaned, I want to calculate total sales by city for a specified year. I will use the pandas groupby method to group sales by city and year, then sum the sales amounts. I will also add a column to show the year-over-year percentage change using the assign method.
Filtering the dataset
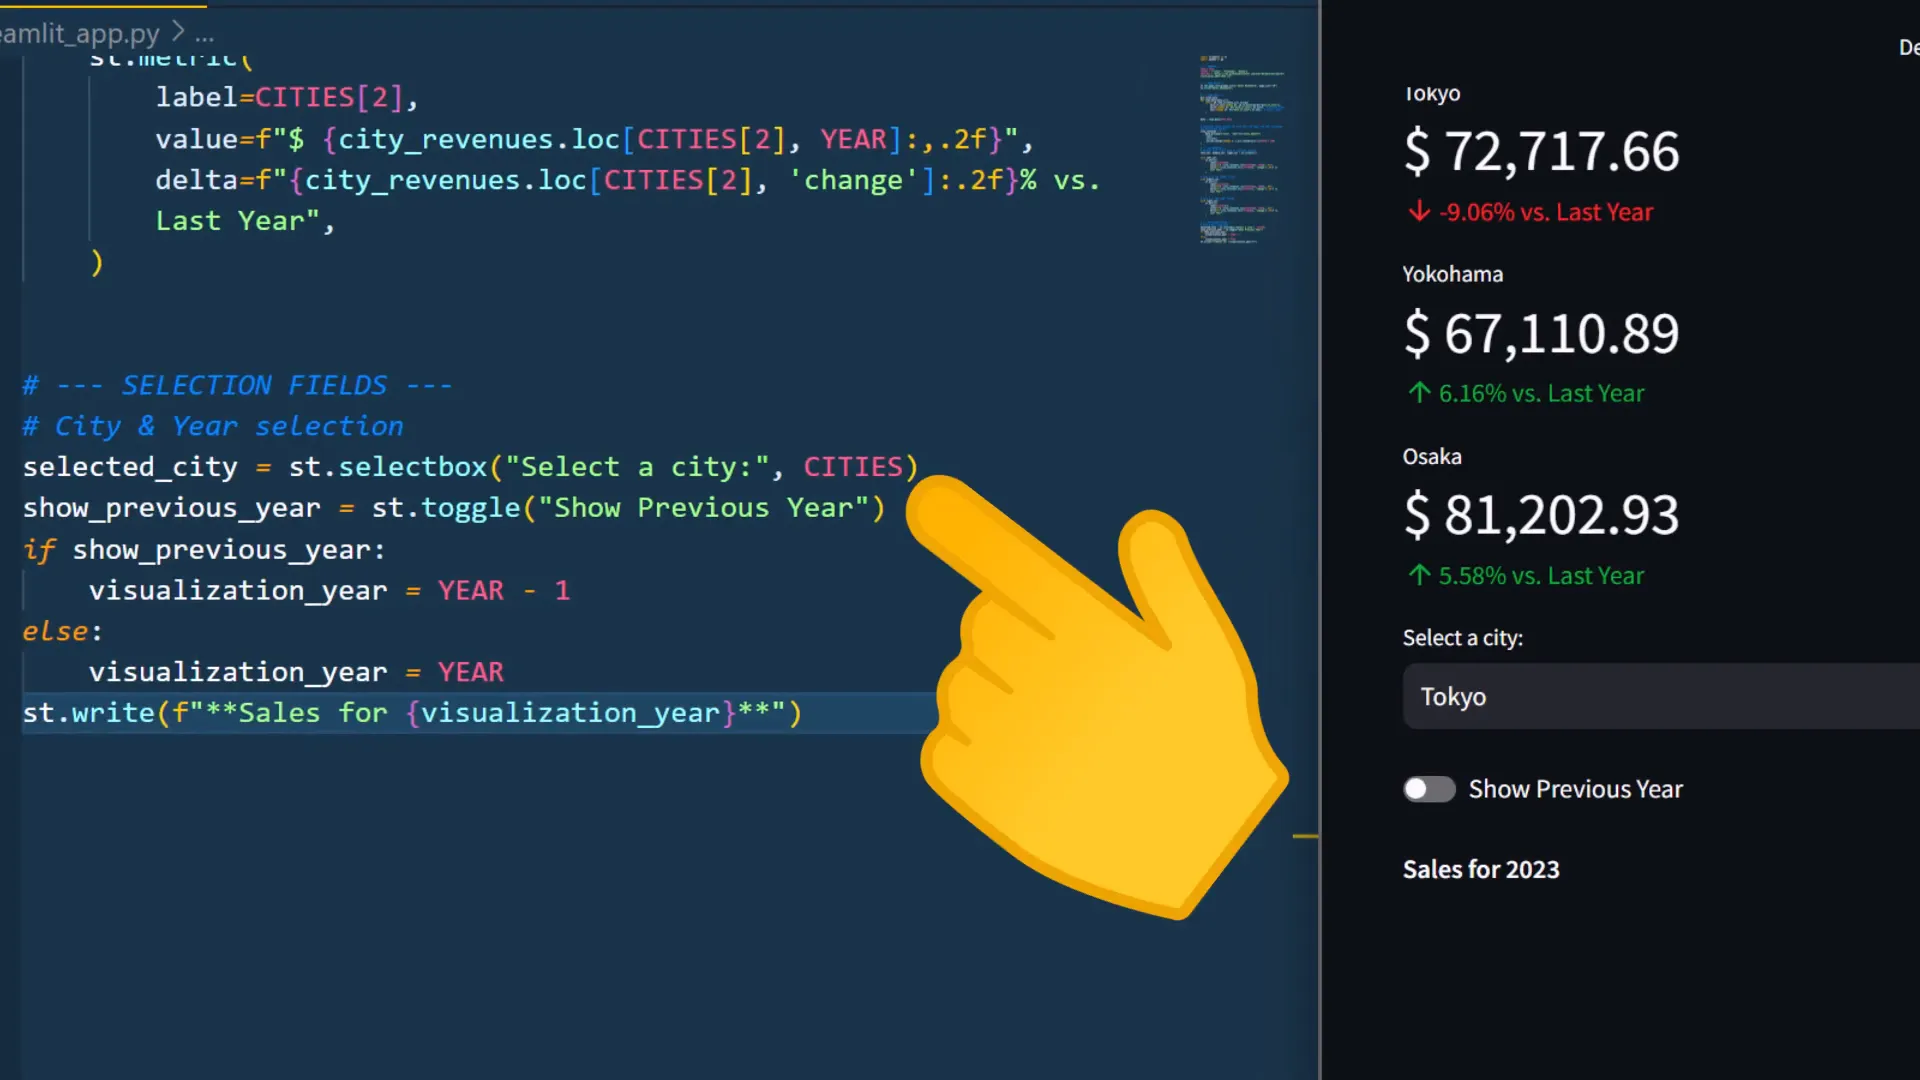
To allow users to filter the dataset, I will add a drop-down menu for selecting a specific city. The selected city will be stored in a variable called selected_city. I will also add a toggle button to switch between the current year and the previous year. Depending on the toggle state, I will adjust the year variable accordingly.
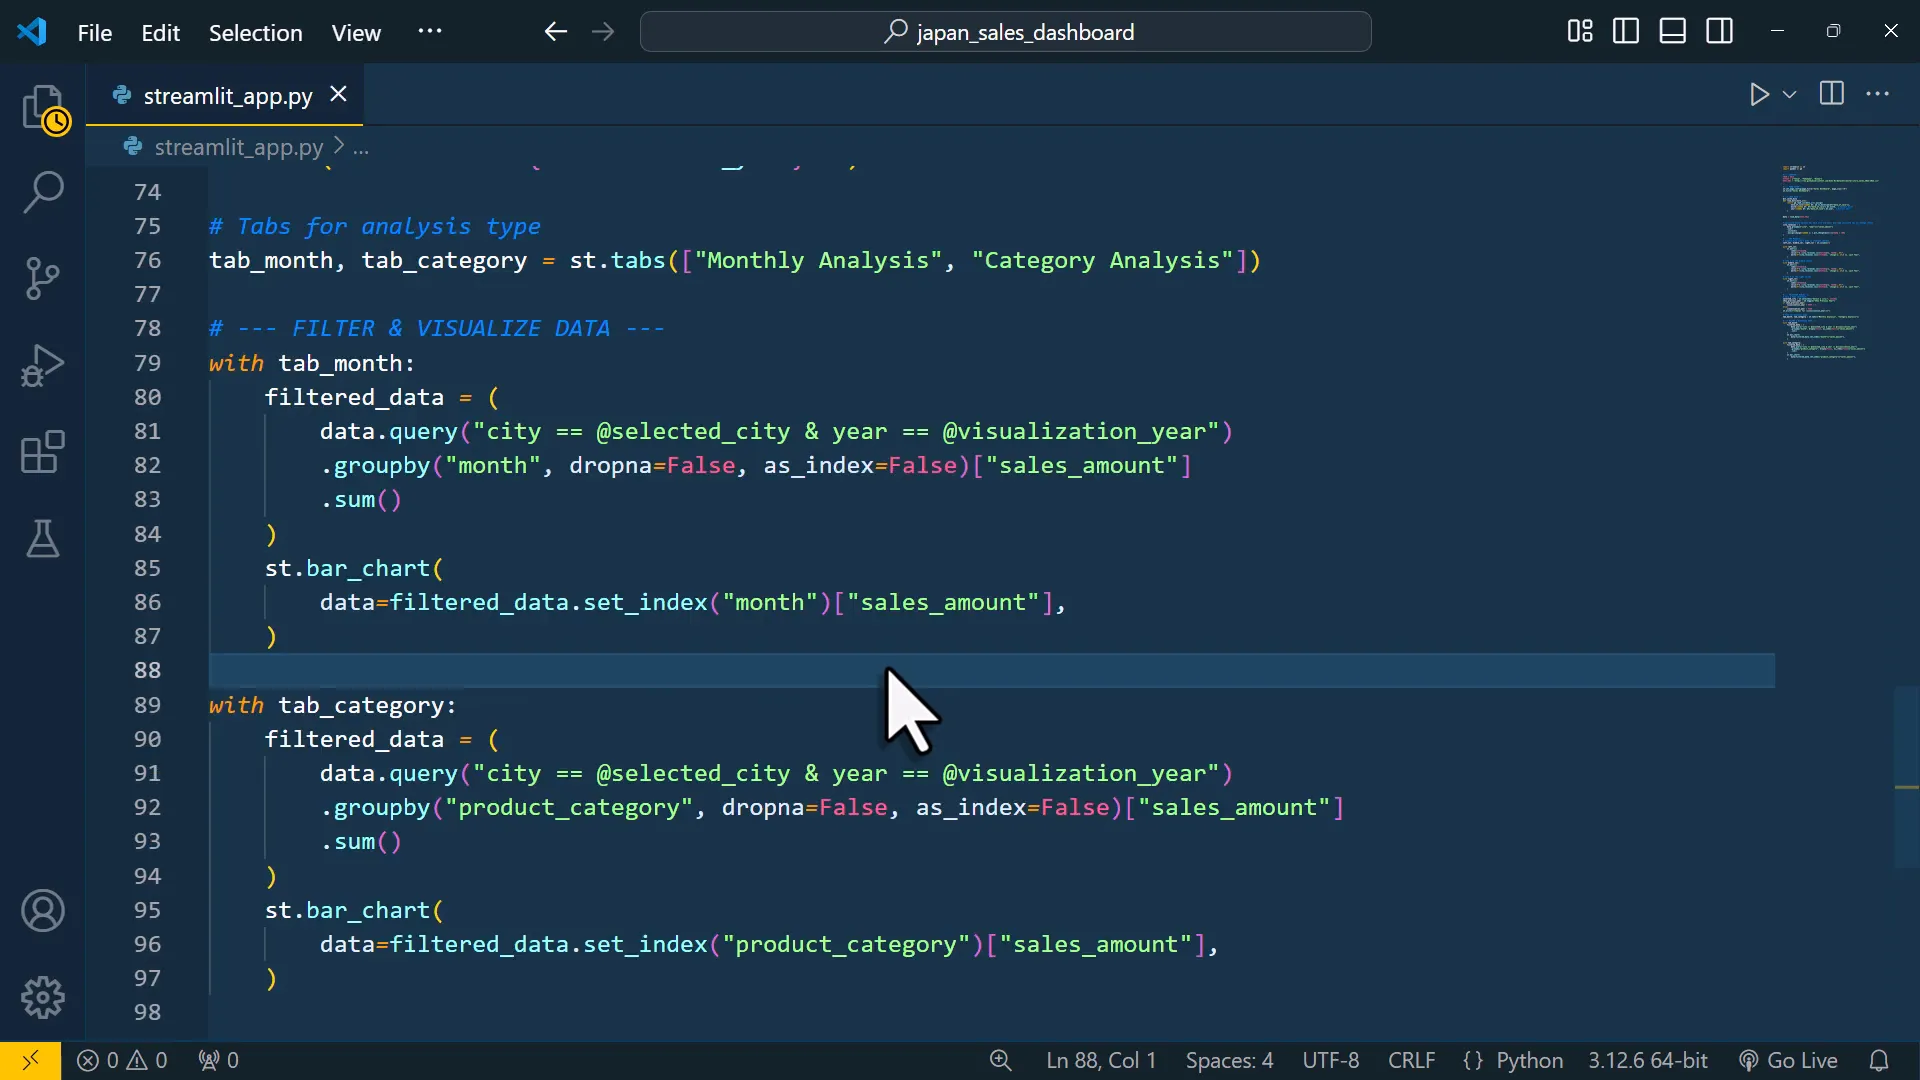
Adding charts to the dashboard
With the selections in place, I want to show two types of analysis: sales by month and sales by category. I will use the query method in pandas to filter the dataset based on the selected city and year. After filtering, I will group the data by month and calculate total sales, and I will create a bar chart to visualize this data.
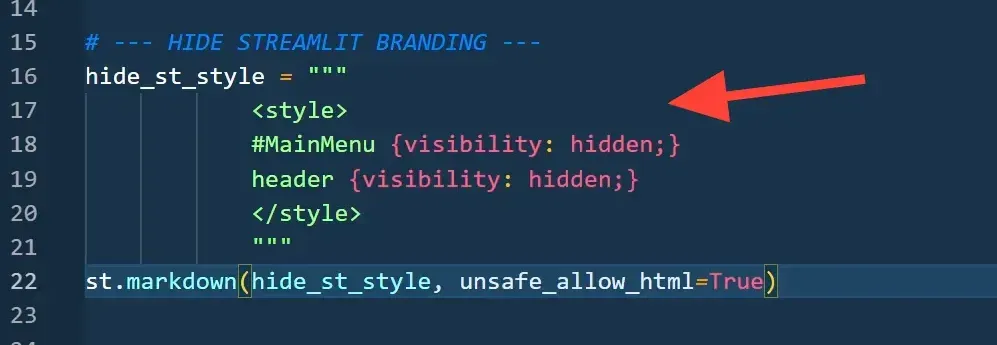
Removing Streamlit branding
To make the app look cleaner, I will remove the default Streamlit branding at the top. I can do this by adding a small snippet of HTML and CSS using Streamlit’s Markdown element with allow_html=True. This will give the app a more professional appearance.
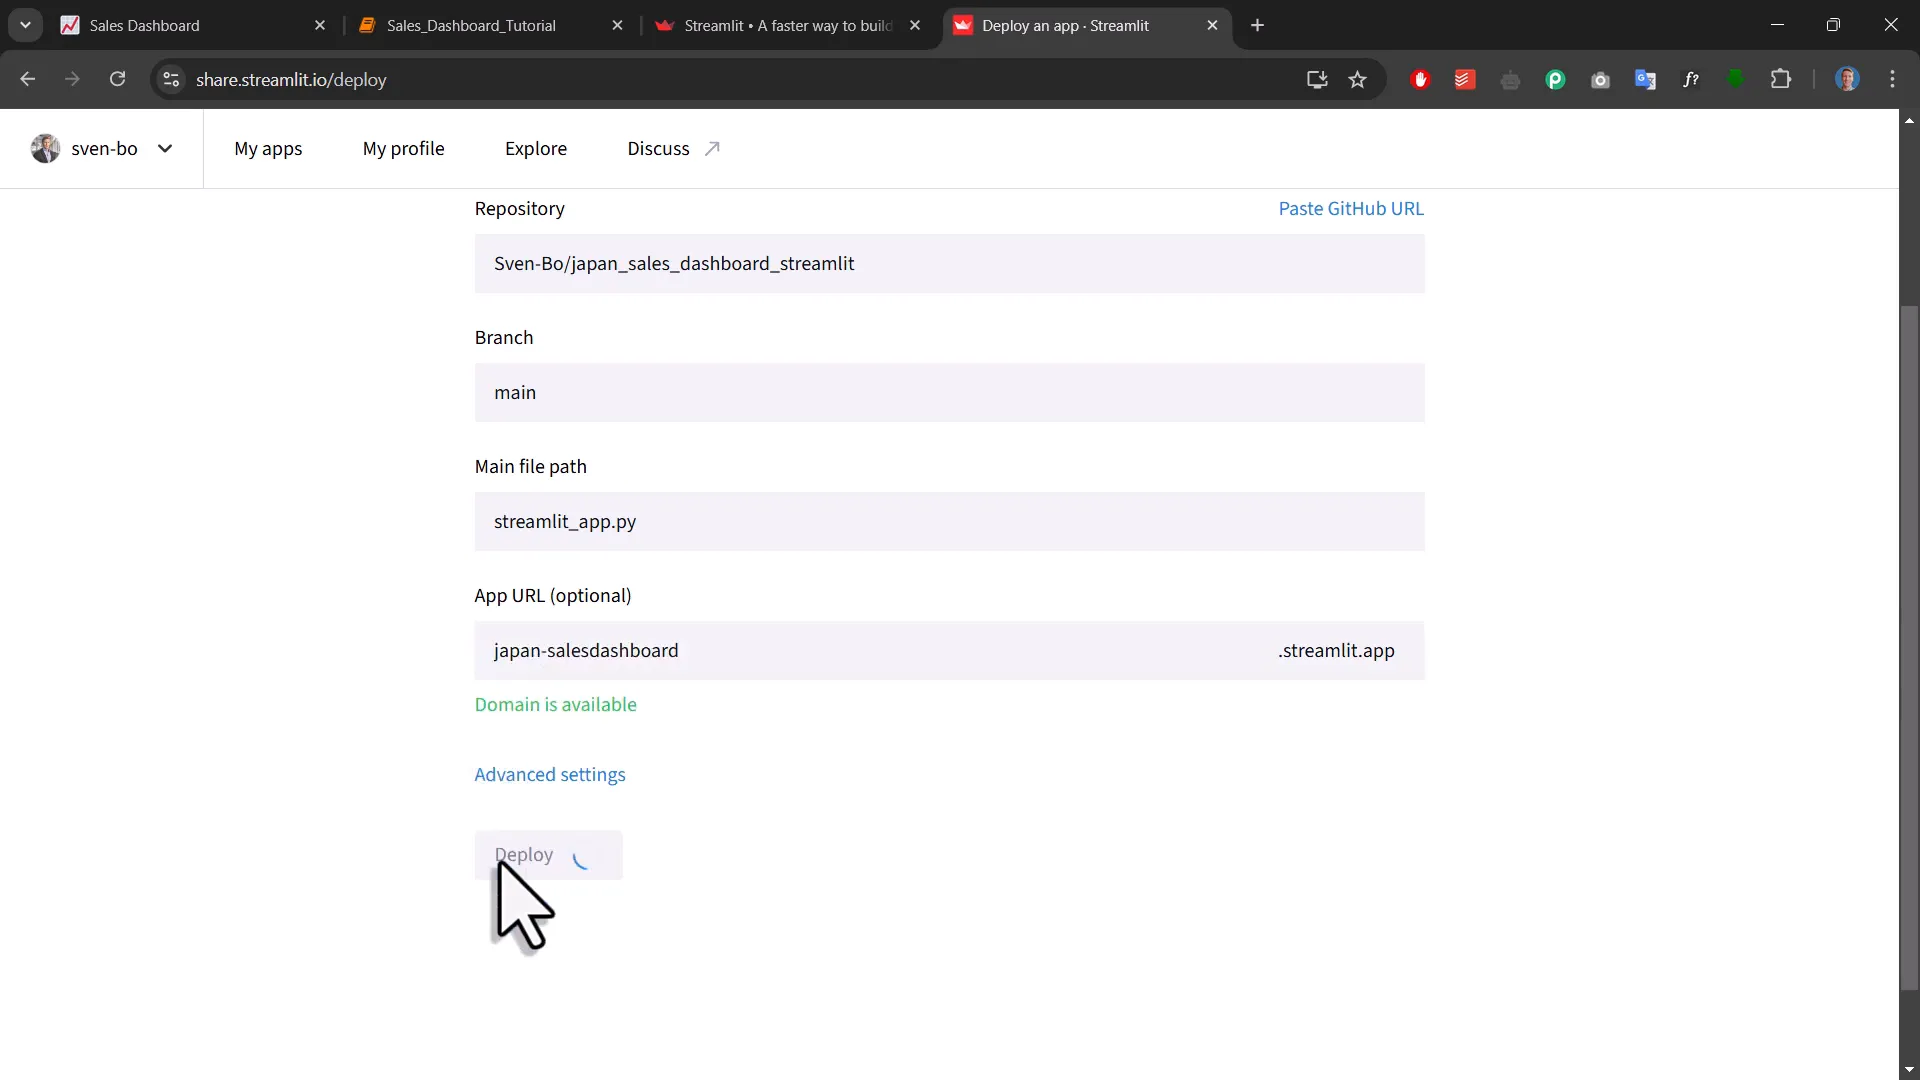
Deploying the app online
Finally, I will deploy the application online. I will upload my code to GitHub and create a requirements.txt file to specify the packages needed for the server. After setting everything up, I will go to Streamlit Community Cloud, create an account, and deploy my app. Once deployed, my sales dashboard will be live on the internet!
Streamlit course announcement
I am planning to create a full Streamlit course in the future, where we will build a more advanced application. If you’re interested, you can sign up for the waiting list on my website.
Conclusion
In this post, I showed you how to build a Python dashboard using Streamlit and deploy it online. We covered installing dependencies, loading and cleaning data, creating a simple web app, and adding interactive elements like filters and charts. Thanks for reading!