
Select Excel2PPT > Setup to open the table, or Create setup if the workbook does not have one yet. Each row describes one exported object or one text replacement.
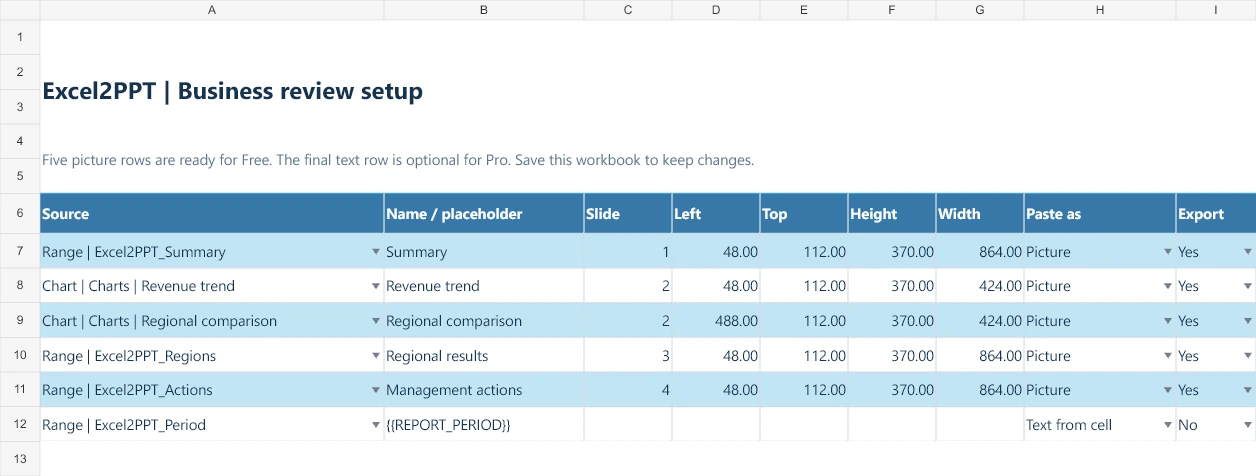
| Column | What to enter |
|---|---|
| Source | Choose a named range, Excel Table, chart or shape. For text from a cell, enter a single-cell reference such as Dashboard!B2. For fixed text, enter the replacement text itself. |
| Name / placeholder | A label for an object, or the exact PowerPoint text to replace, such as {{TITLE}}. |
| Slide | The destination slide number. Objects default to slide 1. For text replacement, leave it blank to search all slides. |
| Left / Top | The object’s position, measured from the slide’s left and top edges, in PowerPoint points. |
| Height / Width | The object’s size in PowerPoint points. There are 72 points in one inch. |
| Paste as | Picture, Editable chart, Linked chart, Text from cell or Fixed text. Blank defaults to Picture. |
| Export | Yes includes the row. No keeps the row for later and skips it during export. |
Add and refresh sources #
Select cells, a chart or a shape and use Add selection to capture it. After adding or renaming workbook objects, select Refresh sources to update the dropdown choices. Source filters in Settings control the choices shown; existing mappings remain usable.
Position objects #
Leave dimensions blank to use automatic placement with margins and title space. Fill individual fields to override them, or use Dimension Finder to copy a PowerPoint object’s measurements.
Maintain the table #
Add, remove, sort and fill down rows using normal Excel table controls. Keep the column names and order unchanged. The table supports up to 1,000 object rows and 1,000 text replacement rows, with 2,000 rows in total. Save the workbook to retain your changes.