
A map with hundreds or thousands of pins turns into a blob. PinPop has two ways to keep it readable: grouping nearby pins, in every version, and the heat map, in Pro. Both are in the Layers menu of the toolbar.
Group nearby pins #
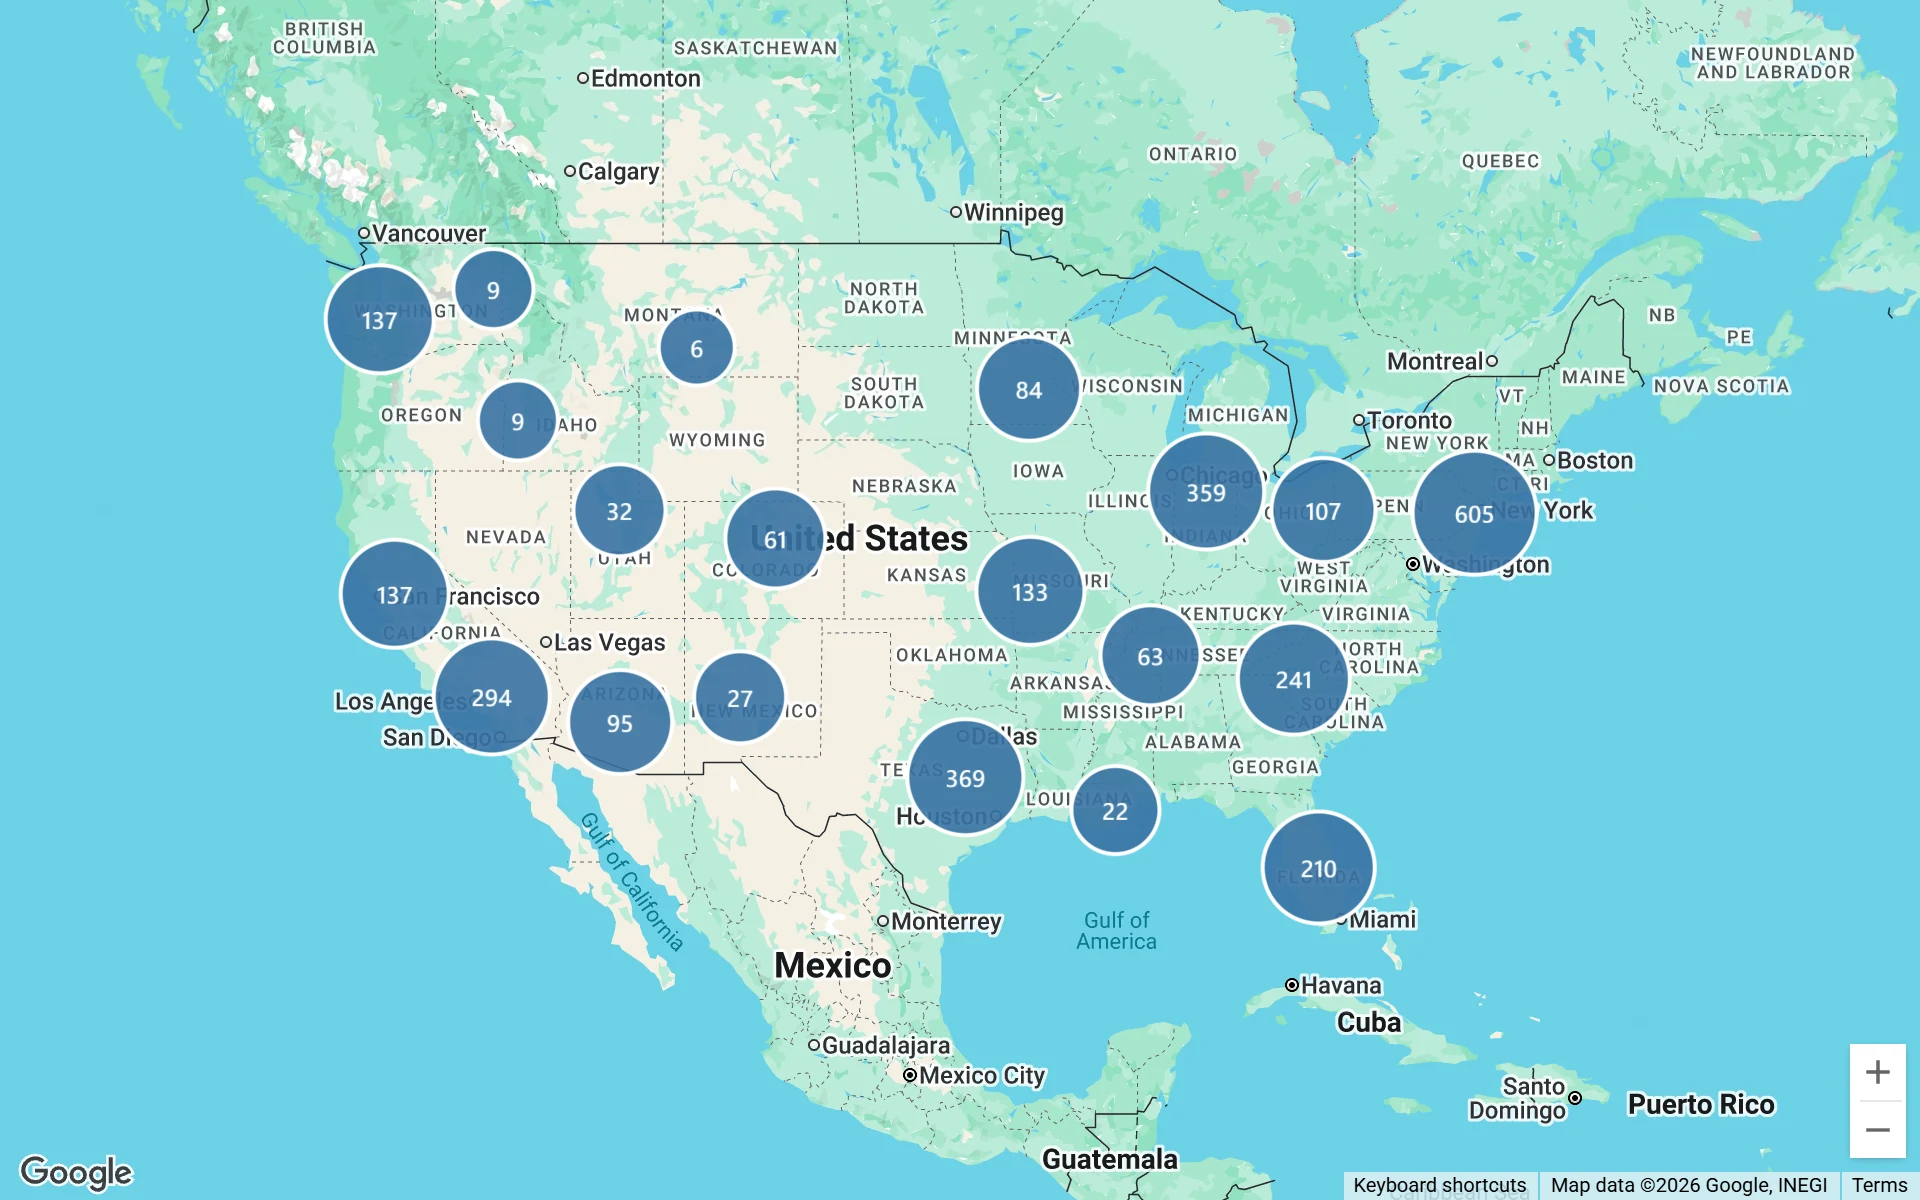
Grouping turns many close pins into one bubble, labeled with how many rows it holds. The bigger the count, the bigger the bubble. As you zoom in, a bubble splits into smaller ones and finally into single pins.
- Group nearby pins is on by default: when more than 500 pins are in view, PinPop groups them by itself, and shows single pins again when you zoom in far enough.
- Turn it off in Layers to always see single pins.
- The free version shows at most 50 pins, so grouping appears on larger Pro maps.
Click a bubble to zoom into it; at the closest zoom it opens the list of the rows there.
The bubbles are blue and show the count only. Single pins between them keep their Color by colors.
Heat map (Pro) #
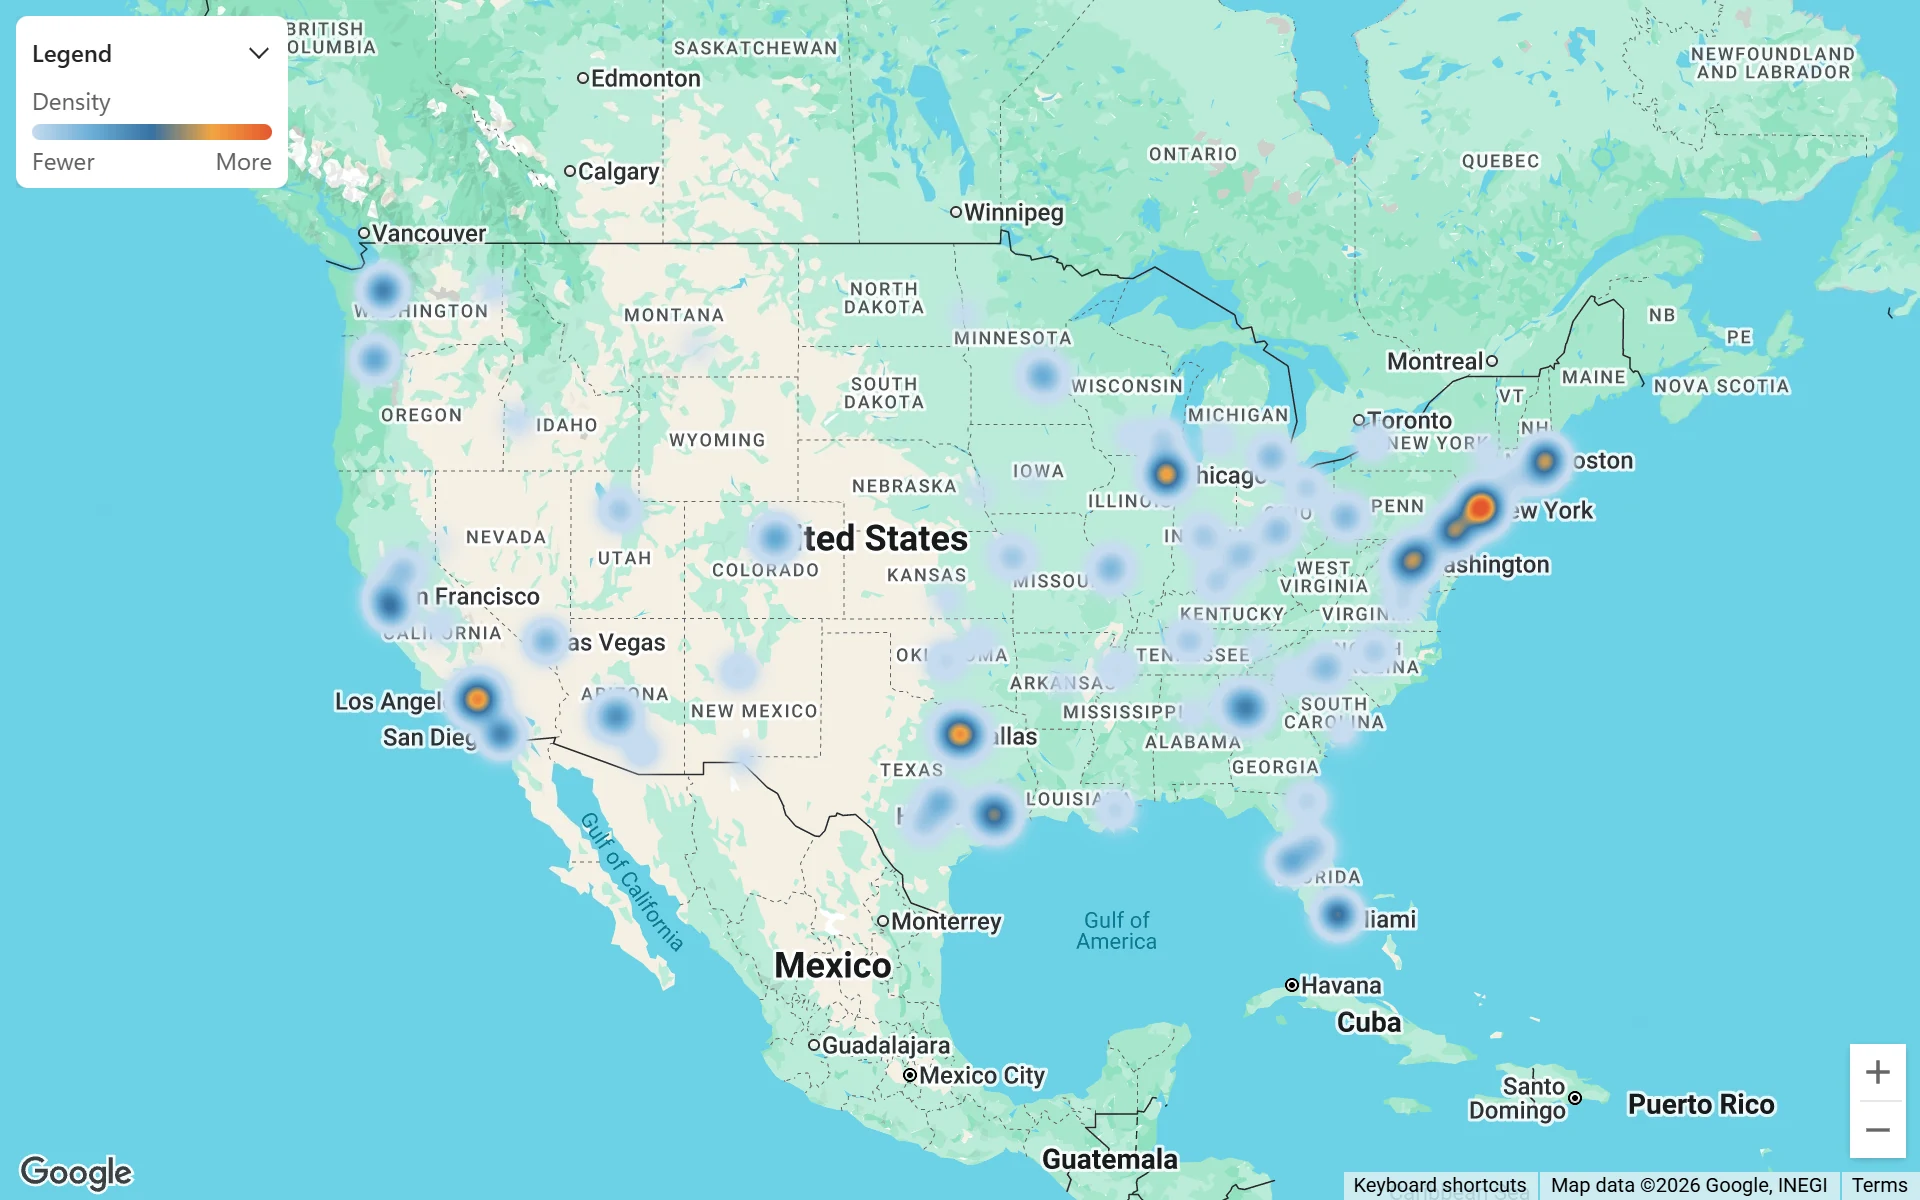
The heat map shows where your rows are dense as a colored surface instead of single pins: customer density, where jobs pile up, which areas have the most stores.
- Open Layers and click Heat map.
- Optional: click Style and set the Heat map options:
- Weight: None, each row counts once, or a number column, such as revenue or order count, so bigger rows count more.
- Spread: Small, Medium or Large, how far each row’s heat reaches.
The legend shows the scale from Fewer to More, titled Density, or with the name of the weight column when you chose one.
You can keep Pins on with the heat map to see both, or turn pins off in Layers for a clean surface. The heat map follows filters like the pins do, and Download PNG and Place picture in sheet include it.
On the free version, Heat map carries a Pro badge and opens a card that explains it, with Get Pro and Enter license key.
How many pins #
The free version shows up to 50 pins per map, Pro up to 50,000. See How many addresses can I map?