
Color by gives every value of one column its own pin color: regions, sales reps, customer types, order status, store formats. It is part of the free version.
Steps #
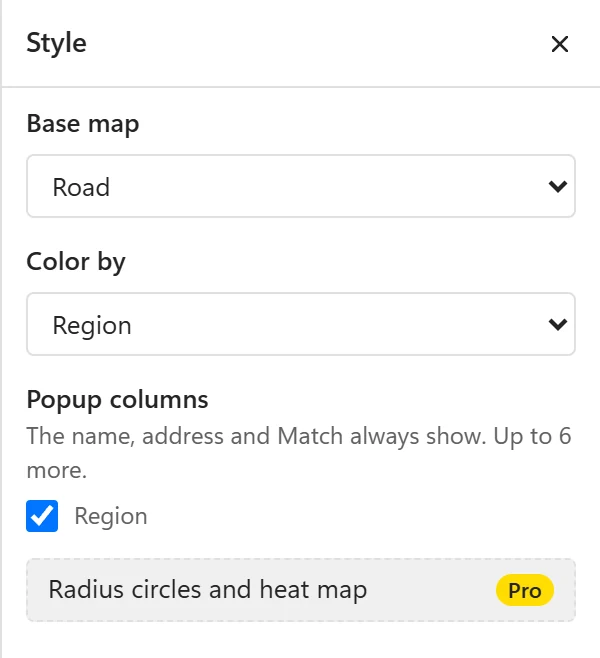
- Click Style in the toolbar. The side panel opens next to the map.
- Under Color by, choose a column.
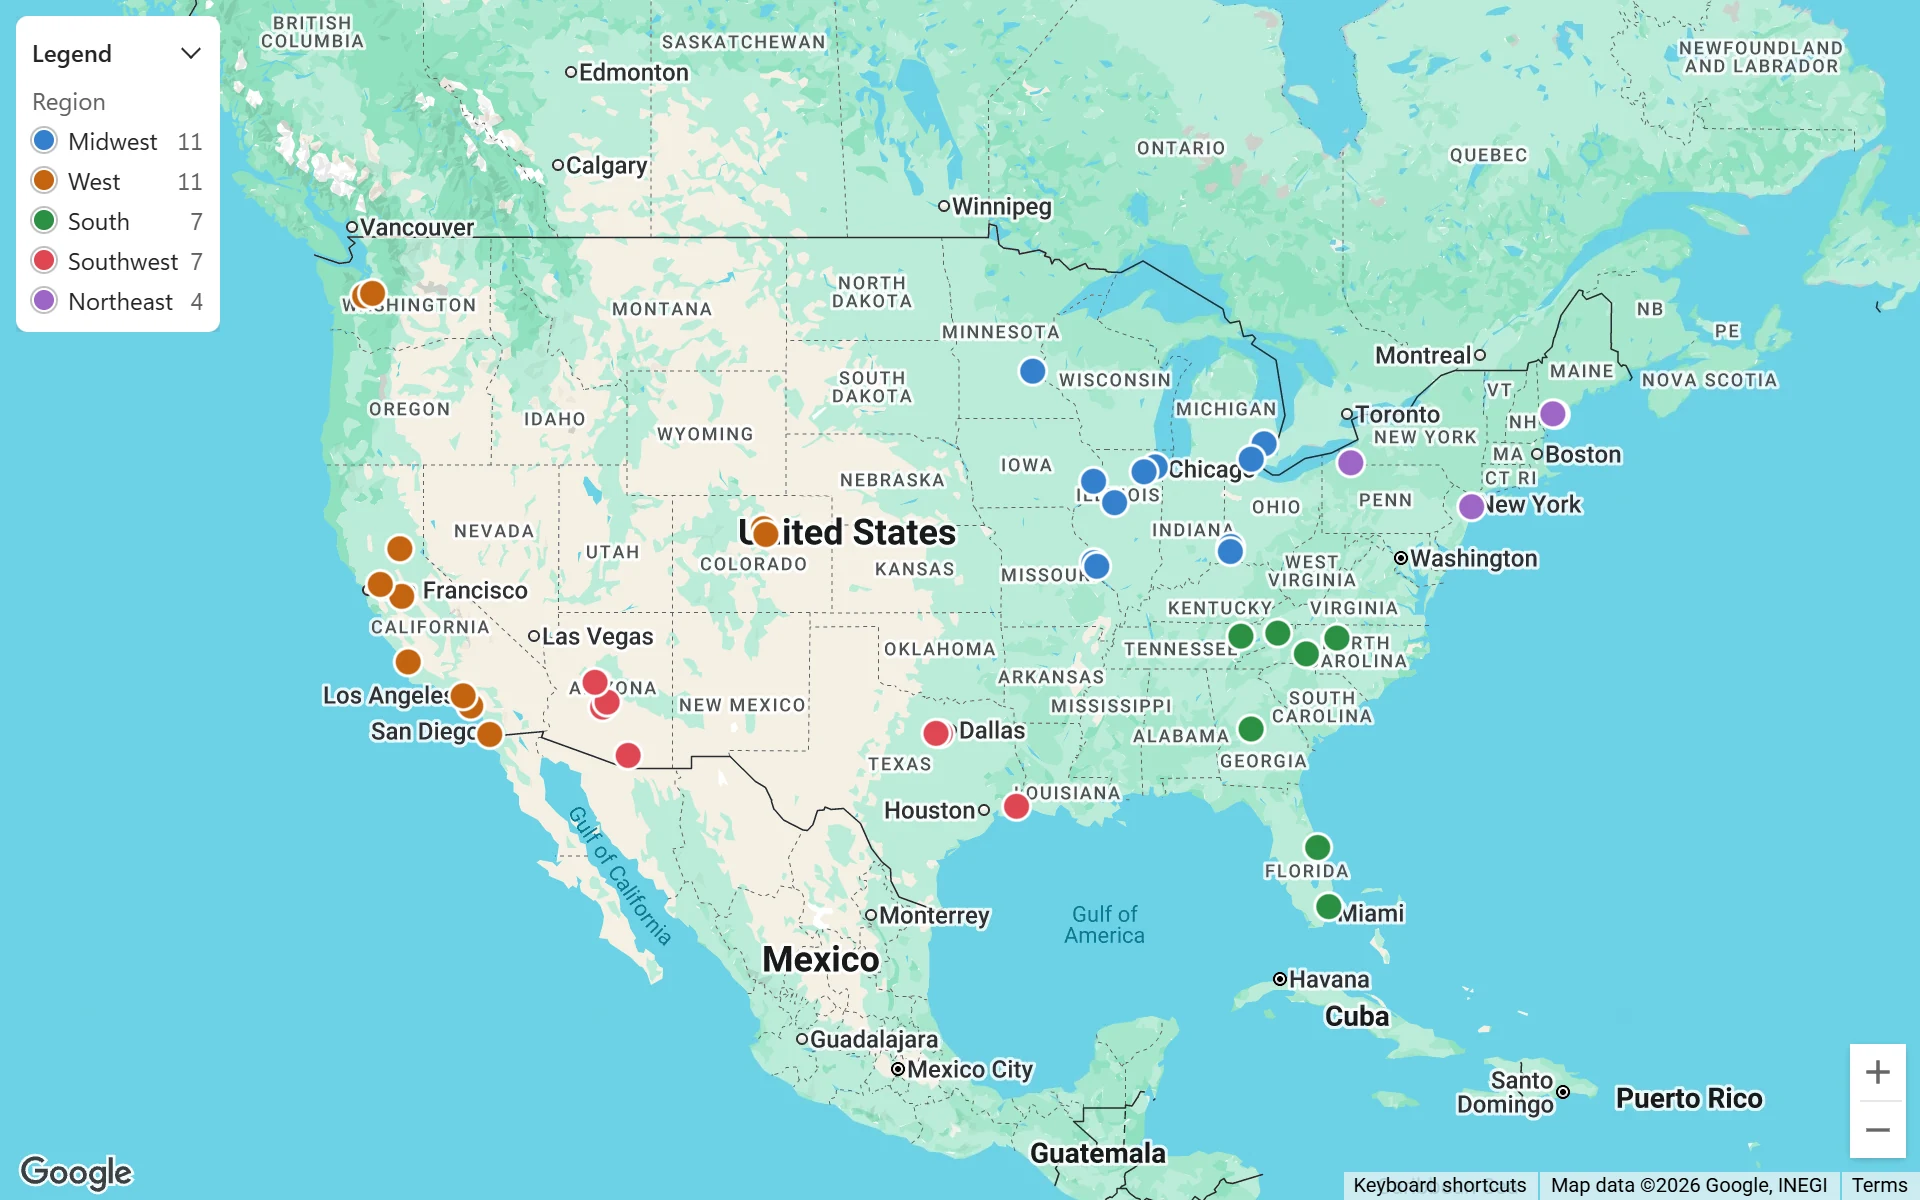
The pins change at once. The legend appears at the top left of the map.
The same panel starts with Base map, a list with Road, Light, Dark, Satellite and Satellite with labels.
To go back to plain pins in the brand blue, choose None.
Which columns you can pick #
Color by lists the columns with a few repeated values, between 2 and 50 different ones, such as Region, Status or Type. A column where almost every row differs, such as Name or Address, would give every pin its own color and is not offered. If no column fits, the panel says No column with a few repeated values to color by.
Colors and the legend #
- The 10 most frequent values get 10 distinct colors, picked to stay readable on light and dark base maps. Any further values and empty cells share a gray listed as Other.
- The legend lists each value with its color, most frequent first. Click the Legend header, which has a small arrow, to fold it away and again to bring it back. In a narrow frame, or when the legend is long, it starts folded away. The Style panel makes the map narrower, so a legend that appears while the panel is open can start folded too.
- The legend never covers Google’s logo or the map attribution, and it is included in exports.
When the table changes #
Color by follows the table: the colors and the legend are worked out again from the current values, so a new value appears in the legend and a row whose value you change switches color. Rows hidden by a filter leave the map, so a filter on the same column is a quick way to show one group; see Filter the map.
PinPop remembers the column by its header name. If you rename the header, choose the column again in Style.