
You filter the map the way you filter the table. PinPop leaves rows that Excel hides off the map, so the filter buttons in the header row, slicers and the search box of a filter all work on the map too. Follow filters is always on; there is nothing to set.
Steps #
- Click the filter button in a header of your table, for example Region.
- Pick the values to show and click OK.
Excel hides the other rows, and only those pins stay on the map.
Click Fit to pins in the toolbar to zoom to the pins that are left. Clear the filter and the pins come back.
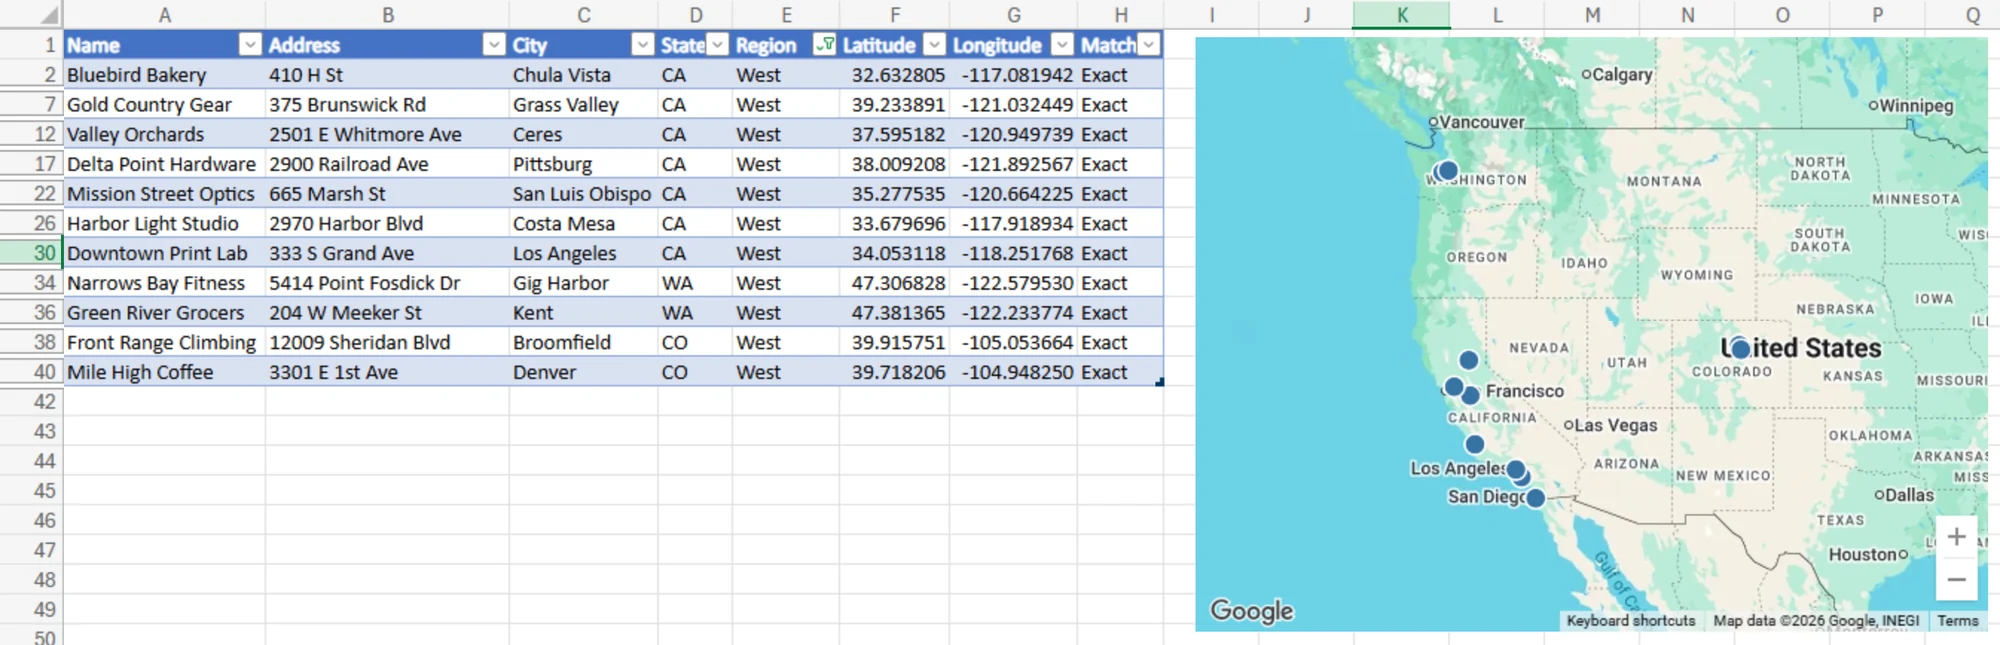
What follows a filter #
- Pins, grouped pins, the heat map and radius circles show only the visible rows.
- Download PNG and Place picture in sheet export what the map shows, so a filtered map is a quick way to make one picture per region.
Rows you hide by hand (right-click a row number, Hide) leave the map the same way.
Filters and the free limit #
The free version shows the first 50 rows of the table. A filter hides pins among those 50 rows; it does not bring later rows into the map. Pro shows up to 50,000 pins, so every visible row is on the map.
When the map does not follow at once #
Data > Advanced filters, and a few older Excel versions, do not tell add-ins that rows were hidden. The map then catches up on the next change in the table, or when you click Fit to pins.
Other ways to show part of the list #
- Color the pins by the column you would filter on, to see every group at once: Color pins by a column.
- Insert a second map for a second table or view (Pro adds more maps per workbook).